Economic Growth in Developing Countries: The Role of Human Capital
Eric Hanushek
Stanford University
April 2013
Abstract
The focus on human capital as a driver of economic growth for developing countries has led to
undue attention on school attainment. Developing countries have made considerable progress in closing
the gap with developed countries in terms of school attainment, but recent research has underscored the
importance of cognitive skills for economic growth. This result shifts attention to issues of school quality,
and there developing countries have been much less successful in closing the gaps with developed
countries. Without improving school quality, developing countries will find it difficult to improve their
long run economic performance.
JEL Classification: I2, O4, H4
Highlights:
Improvements in long run growth are closely related to the level of cognitive skills of the
population.
Development policy has inappropriately emphasized school attainment as opposed to educational
achievement, or cognitive skills.
Developing countries, while improving in school attainment, have not improved in quality terms.
School policy in developing countries should consider enhancing both basic and advanced skills.
Keywords: economic development, economic impact, demand for schooling

2
Economic Growth in Developing
Countries: The Role of
Human Capital
Eric Hanushek
Stanford University
The role of improved schooling has been a central part of the development strategies of
most countries and of international organizations, and the data show significant improvements in
school attainment across the developing world in recent decades. The policy emphasis on
schooling has mirrored the emphasis of research on the role of human capital in growth and
development. Yet, this emphasis has also become controversial because expansion of school
attainment has not guaranteed improved economic conditions.
1
Moreover, there has been
concern about the research base as questions have been raised about the interpretation of
empirical growth analyses. It appears that both the policy questions and the research questions
are closely related to the measurement of human capital with school attainment.
Recent evidence on the role of cognitive skills in promoting economic growth provides
an explanation for the uncertain influence of human capital on growth. The impact of human
capital becomes strong when the focus turns to the role of school quality. Cognitive skills of the
population – rather than mere school attainment – are powerfully related to individual earnings,
to the distribution of income, and most importantly to economic growth.
A change in focus to school quality does not by itself answer key questions about
educational policy. Other topics of considerable current interest enter into the debates: should
1
See,forexample,Easterly(2001)orPritchett(2006).
3
policy focus on basic skills or the higher achievers? Also should developing countries work to
expand their higher education sector? The currently available research indicates that both basic
skills and advanced skills are important, particularly for developing countries. At the same time,
once consideration is made of cognitive skills, the variations in the amount of tertiary education
have no discernible impact on economic growth for either developed or developing countries.
This paper puts the situation of developing countries into the perspective of recent work
on economic growth. When put in terms of cognitive skills, the data reveal much larger skill
deficits in developing countries than generally derived from just school enrollment and
attainment. The magnitude of change needed makes clear that closing the economic gap with
developed countries will require major structural changes in schooling institutions.
The Measurement of Human Capital in Economic Growth
In the late 1980s and early 1990s, empirical macroeconomists turned to attempts to
explain differences in growth rates around the world. Following the initial work of Barro (1991),
hundreds of separate studies – typically cross-sectional regressions – pursued the question of
what factors determined the very large observed differences. The widely different approaches
tested a variety of economic and political explanations, although the modeling invariably
incorporated some measure of human capital.
The typical development is that growth rates (g) are a direct function of human capital
(H), a vector of other factors (X), and a stochastic element (
) as in:
(1)
grHX

4
where r and
are unknown parameters to be estimated. The related empirical analysis employs
cross-country data in order to estimate the impact of the different factors on growth.
2
From a very early point, a number of reviews and critiques of empirical growth modeling
went to the interpretation of these studies. The critiques have focused on a variety of aspects of
this work, including importantly the sensitivity of the analysis to the particular specification
(e.g., Levine and Renelt (1992)). They also emphasized basic identification issues and the
endogeneity of many of the factors common to the modeling (e.g., Bils and Klenow (2000)).
In both the analysis and the critiques, much of the attention focused on the form of the
growth model estimated – including importantly the range of factors included – and the
possibility of omitted factors that would bias the results. Little attention was given to
measurement issues surrounding human capital. This oversight in the analysis and modeling
appears to be both explicable and unfortunate.
A short review of the history of human capital modeling and measurement helps to
explain the development of empirical growth analysis. Consideration of the importance of skills
of the workforce has a long history in economics, and the history helps to explain a number of
the issues that are pertinent to today’s analysis of economic growth. Sir William Petty (1676
[1899]) assessed the economics of war and of immigration in terms of skills (and wages) of
individuals. Adam Smith ([1776]1979) incorporated the ideas in the Wealth of Nations, although
ideas of specialization of labor dominated the ideas about human capital. Alfred Marshall
(1898), however, thought the concept lacked empirical usefulness, in part because of the severe
measurement issues involved.
2
DetaileddiscussionofthisgrowthmodelandofvariantsofitcanbefoundinHanushekandWoessmann(2008).
5
After languishing for over a half century, the concept of human capital was resurrected
by the systematic and influential work of Theodore Schultz (1961), Gary Becker (1964), and
Jacob Mincer (1970, (1974), among others. Their work spawned a rapid growth in both the
theoretical and empirical application of human capital to a wide range of issues.
The contributions of Mincer were especially important in setting the course of empirical
work. A central idea in the critique of early human capital ideas was that human capital was
inherently an elusive concept that lacked any satisfactory measurement. Arguing that differences
in earnings, for example, were caused by skill or human capital differences suggested that
measurement of human capital could come from observed wage differences – an entirely
tautological statement. Mincer argued that a primary motivation for schooling was developing
the general skills of individuals and, therefore, that it made sense to measure human capital by
the amount of schooling completed by individuals. Importantly, school attainment was
something that was frequently measured and reported. Mincer followed this with analysis of
how wage differentials could be significantly explained by school attainment and, in a more
nuanced form, by on-the-job training investments( Mincer (1974)). This insight was widely
accepted and has dictated the empirical approach of a vast majority of empirical analyses in labor
economics through today. For example, the Mincer earnings function has become the generic
model of wage determination and has been replicated in over 100 separate countries
(Psacharopoulos and Patrinos (2004)).
Owing in part to the power of the analysis of Mincer, schooling became virtually
synonymous with the measurement of human capital. Thus, when growth modeling looked for a
measure of human capital, it was natural to think of measures of school attainment.

6
The early international modeling efforts, nonetheless, confronted severe data issues.
Comparable measures of school attainment across countries did not exist during the initial
modeling efforts, although readily available measures of enrollment rates in schools across
countries were a natural bridge to changes in school attainment over time. The early data
construction by Barro and Lee (1993), however, provided the necessary data on school
attainment, and the international growth work could proceed to look at the implications of human
capital.
3
In this initial growth work, human capital was simply measured by school attainment, or
S. Thus, Equation (1) could be estimated by substituting S for human capital and estimating the
growth relationship directly.
4
Fundamentally, however, using school attainment as a measure of human capital In an
international setting presents huge difficulties. In comparing human capital across countries, it is
necessary to assume that the schools across diverse countries are imparting the same amount of
learning per year in all countries. In other words, a year of school in Japan has the same value in
terms of skills as a year of school in South Africa. In general, this is implausible.
A second problem with this measurement of human capital is that it presumes schooling
is the only source of human capital and skills. Yet, a variety of policies promoted by the World
Bank and other development agencies emphasize improving health and nutrition as a way of
3
Thereweresomeconcernsaboutaccuracyofthedataseries,leadingtoalternativedevelopments(Cohenand
Soto(2007))andtofurtherrefinementsbyBarroandLee(2010).
4
Avarietyofdifferentissueshaveconsumedmuchoftheempiricalgrowthanalysis.Atthetopofthelistis
whetherEquation(1)shouldbemodeledintheformofgrowthratesofincomeasthedependentvariable,or
whetheritshouldmodelthelevelofincome.Theformeris
generallyidentifiedasendogenousgrowthmodels
(e.g.,Romer(1990)),whilethelatteristypicallythoughtofasaneoclassicalgrowthmodel(e.g.,Mankiw,Romer,
andWeil(1992)).Thedistinctionhasreceivedasubstantialamountoftheoreticalattention,althoughlittle
empiricalworkhasattemptedtoprovideevidenceonthespecificform(see
HanushekandWoessmann(2008)).

7
developing human capital. These efforts reflect a variety of analyses into various health issues
relative to learning including micro-nutrients (Bloom, Canning, and Jamison (2004)), worms in
school children (Miguel and Kremer (2004)), malaria, and other issues. Others have shown a
direct connection of health and learning (Gomes-Neto, Hanushek, Leite, and Frota-Bezzera
(1997), Bundy (2005)).
This issue is in reality part of a larger issue. In a different branch of research, a vast
amount of research has delved into “educational production functions.” This work has
considered the determinants of skills, typically measured by achievement tests.
5
Thus, this line
of research has focused on how achievement, A, is related to school inputs (R), families (F),
other factors such as neighborhoods, peers, or general institutional structure (Z), and a stochastic
element (
):
(2)
(, ,,)AfRFZ
Much of the empirical analysis of production functions has been developed within
individual countries and estimated with cross-sectional data or panel data for individuals. This
work has concentrated on how school resources and other factors influence student outcomes
(Hanushek (2003)). However, as reviewed in Hanushek and Woessmann (2011a), a substantial
body of work has recently developed in an international context, where differences in schools in
other factors are related to cross-country differences in achievement.
The analysis of cross-country skill differences has been made possible by the
development of international assessments of math and science (see the description in Hanushek
and Woessmann (2011a)). These assessments provide a common metric for measuring skill
5
See,forexample,thegeneraldiscussioninHanushek(2002).

8
differences across countries, and they provide a method for testing directly the approaches to
modeling growth, as found in Equation (1).
6
The fundamental idea is that skills as measured by achievement, A, can be used as a
direct indicator of the human capital of a country in Equation (1). And, as described in Equation
(2), schooling is just one component of the skills of individuals in different countries. Thus,
unless the other influences on skills outside of school are orthogonal to the level of schooling, S,
the growth model that relies on only S as a measure of human capital will not provide consistent
estimates of how human capital enters into growth.
The impact of alternative measures of human capital can be seen in the long run growth
models displayed in Table 1. The table presents simple models of long run growth (g) over the
period 1960-2000 for the set of 50 countries with required data on growth, school attainment,
and achievement (see Hanushek and Woessmann (2012a)). The first column relates growth to
initial levels of GDP and to human capital as measured by school attainment.
7
This basic model
shows a significant relationship between school attainment and growth and explains one-quarter
of the international variation in growth rates. The second column substitutes the direct measure
of skills derived from international math and science tests for school attainment. Not only is
there a significant relationship with growth but also this simple model now explains three-
quarters of the variance in growth rates. The final column includes both measures of human
6
Thisapproachtomodelinggrowthasafunctionofinternationalassessmentsofskilldifferenceswasintroduced
inHanushekandKimko(2000).ItwasextendedinHanushekandWoessmann(2008)andavarietyofother
analysesidentifiedthere.
7
Theinclusionofinitialincomelevelsforcountriesisquitestandardinthisliterature.Thetypicalinterpretationis
thatthispermits“catch‐up”growth,reflectingthefactthatcountriesstartingbehindcangrowrapidlysimplyby
copyingtheexistingtechnologiesinothercountrieswhilemoreadvancedcountriesmustdevelopnew
technologies.Estimatingmodelsinthisformpermitssomeassessmentofthedifferencesbetweenthe
endogenousandneoclassicalgrowthmodelsdiscussedpreviously(seeHanushekandWoessmann(2011b)).
9
capital. Importantly, once direct assessments of skills are included, school attainment is not
significantly related to growth, and the coefficient on school attainment is very close to zero.
These models do not say that schooling is worthless. They do say, however, that only the
portion of schooling that is directly related to skills has any impact on cross-country differences
in growth. The importance of skills and conversely the unimportance of schooling that does not
produce higher levels of skills has a direct bearing on human capital policies for developing
countries.
Finally, the estimated impacts of cognitive skills on growth are very large. The cognitive
skills measure is scaled standard deviations of achievement. Thus, one standard deviation
difference in performance equates to two percent per year in average annual growth of GDP per
capita. The importance of human capital indicated by these estimates combined with the deficits
of developing countries (below) identifies the policy challenges.
Improvement in School Attainment of Developing Countries
With this background on human capital and growth, it is possible to assess the position of
developing countries and their prospects for the future. To provide perspective, this discussion
begins with the traditional measure of human capital, school attainment.
International development agencies have pursued the expansion of schooling as a primary
component of development. Growing out of a 1990 international conference in Jomtien,
Thailand, UNESCO and the World Bank began a movement to achieve “Education for All

10
(EFA)”
8
While this conference developed some fairly general goals, a follow-on conference
became much more specific. A central element of the goals for Education for All is achieving
compulsory and universal primary education in all countries. The 2000 conference included a
commitment to achieving the specific goals by 2015.
The United Nations in 2000 established the Millennium Development Goals (MDG).
9
The second MDG goal was universal primary education, to be achieved by 2015 and consistent
with Education for All. To be sure, both the MDG’s and the EFA goals recognize that quality is
an issue, and both suggest that quality should be monitored. But, the ease of measurement of
school completion and the ability to assess progress toward the specific goals imply that
qualitative issues of schooling receive considerably less attention.
The data on school attainment show dramatic growth and improvement of developing
countries. Table 2 charts the progress since 1991 in school attainment across the developed and
developing world.
The developed world has maintained high levels of net enrollment at about 95 percent.
Transitional economies have slightly improved over these two decades. But developing
countries have closed half of the gap of their enrollment rates compared to those in developed
countries.
The similar picture holds for school expectancy. All countries have on average increased
school expectancy over the period 1991-2008. And, again, the largest gains are in developing
counties that on average added two years to their average school completion, reaching 10.4 years
8
Seethehistoryandframeworkat:http://en.wikipedia.org/wiki/Education_For_All[accessedFebruary10,2012].
9
Seethehistoryandframeworkat:http://en.wikipedia.org/wiki/Millennium_Development_Goals[accessed
February10,2012].

11
in 2008. Developed countries also made significant gains, moving to 15.9 years by 2008, so the
closing of schooling gaps has been relatively slow. But, there is no doubt that there have been
steady gains in developing countries.
These are the data typically used to judge the progress and the challenges facing the
developing world. But the previous discussion of the measurement of human capital suggests
that the data on school attainment – the focus of international monitoring – may be misleading
without consideration of how much students are learning.
Better Measures of the Human Capital Deficit in Developing Countries
International data on skills are most readily available for developed countries, but in
recent years their availability in developing countries has expanded dramatically. There are two
current sources of assessments: the International Association for the Evaluation of Educational
Achievement (IEA) which has produced the TIMSS assessments and related tests
10
; and the
Organisation for Economic Cooperation and Development (OECD which has produced the PISA
assessments.
11
These assessments, which were used in the skill measures that went into Table 2,
have somewhat different test developments, age coverage, and country sampling. Nevertheless,
they provide a clear indication of the skill differentials across countries that were absent from the
prior discussion of school attainment.
10
TheIEAtestswerethefirstsuchassessments,begunwiththeFirstInternationalMathStudy(FIMS)in1964and
continuingthroughthemostrecentTrendsinMathematicsandscienceStudy(TIMSS)in2007.
11
TheProgrammeofInternationalStudentAssessment(PISA)startedin2000andhascontinuedatthreeyear
intervalsthrough2009.Ithasexpandedcountrycoveragesignificantlyovertime.

12
Table 3 provides basic measures of math competencies for a sample of developing
countries that have participated in the 2009 PISA assessment of mathematics. The PISA
assessments of performance of 15-year-olds categorize students in Levels 1-6. Level 1, which
includes scores 0.8 standard deviations or more below the OECD mean, relates to the most
rudimentary knowledge. The performance levels are described in Organisation for Economic
Co-operation and Development (2010): “Students proficient at Level 1 can answer questions
involving familiar contexts where all relevant information is present and the questions are clearly
defined. They are able to identify information and to carry out routine procedures according to
direct instructions in explicit situations. They can perform obvious actions that follow
immediately from the given stimuli.” At this level of knowledge, students will have a difficult
time participating in a modern workforce that includes new technologies, and they will have
trouble adjusting to changes in these technologies. Such students are likely to have serious
difficulties using mathematics to benefit from further education and learning opportunities
throughout life.
Across OECD countries, an average of 14 percent of students perform at Level 1, and 8
percent perform below Level 1. But, Table 3 illustrates the plight of a number of countries
where over 40 percent of the students (who are still in school at age 15) are performing at Level
1 or below in 2009.
12
Restricting the assessments to those who are still in school at 15 is also
an important caveat, since many still drop out before grade 9. If the less able students tend to be
12
Notethatthesearenotallofthedevelopingcountries.ThesearethecountriesthatbothparticipatedinPISA
2009andhadsuchsubstantialnumbersperformingatthebottomlevels.Thevastmajorityofdeveloping
countrieshaveneverparticipatedinthePISAexaminations.Althoughasomewhatlargernumberofdeveloping
countrieshasparticipatedintheTIMSSassessments,theirperformancerelativetodevelopedcountriesisnot
noticeablybetter.

13
the earliest drop outs, the data on achievement of 15-year-olds will overstate the performance of
children in these countries.
The deficit of developing countries can be better illustrated by considering the full
distribution of outcomes for countries, i.e., by merging the typical school attainment data with
the achievement data from the international assessments. A graph that highlights the alternative
perspectives of the traditional focus on attainment and the achievement focus can be found in
Figure 1. In the separate panels, the pattern of school attainment – taken from recent household
surveys – is combined for a subset of countries with the minimal skill achievement from PISA.
13
PISA tests achievement for a representative sample of 15-year-olds in each country and thus can
be taken as a measure of the competencies of the subset of students in each country that
completes grade 9.
Take Peru as an example.
14
Sixty percent of students make it at least through grade 9.
Assuming that the students with the highest achievement levels complete the most schooling and
applying an even looser definition of “modern literacy” – scoring within one standard deviation
of the OECD average – shows that only 20 percent of ninth grade completers and only 12
percent of the population is fully literate.
15
Comparable calculations for full literacy yield 21
percent in the Philippines and just seven percent in South Africa. Thus, the performance in terms
of school attainment may show some success and promise, but this stands in contrast to the
13
SeethedescriptioninHanushekandWoessmann(2008).Thesefiguresrelyonhouseholdsurveysgenerally
donearound2000;theachievementdatausetheclosestinternationalassessmentdata.
14
PeruisactuallyillustrativeofamuchlargerprobleminLatinAmericawhereachievementhaslaggedsignificantly
behindtheexpansionofschoolattainment.ThislaginfactcanfullyexplainwhygrowthratesinLatinAmerican
countrieshavebeendisappointinglysmall(HanushekandWoessmann(2012b)).
15
OnestandarddeviationawayfromtheOECDaverageonPISAtestsis400points.ThetopoftheLevel1range
illustratedpreviouslywas420pointsinmathematicsin2009.

14
performance in terms of internationally competitive skills. The general narrowing of the human
capital deficit shown in Table 2 is far less evident in Table 3 and Figure 1.
International agencies have not completely ignored the possibility that there are school
quality differences across countries. Indeed both Education for All and the Millennium
Development Goals include mention of quality in their goals. But when they have developed
measures of quality to parallel the attainment data, they have employed school input measures.
Thus, for example, the quality measures in UNESCO (2006) include: pupil/teacher ratio, %
female teachers, % trained teachers, public current expenditure on primary education as a percent
of GDP, and public current expenditure per pupil on primary education. Unfortunately, the large
volume of studies that have looked at educational production functions in both developed and
developing countries has shown little relationship between any of these measures and student
achievement.
16
As a result, the focus of much of the international attention to human capital
development appears less successful than commonly available reports might suggest.
In terms of the growth analysis, one standard deviation in achievement is related to two
percentage point higher long run growth. While one standard deviation is a large skill
difference, the a significant number of developing countries participating in the PISA 2009
assessments were more than this far behind the OECD average: Argentina, Jordan, Brazil,
Colombia, Albania, Tunisia, Indonesia, Qatar, Peru, Panama, and Kyrgyzstan.
Varying Human Capital Approaches for Developing Countries
16
TheevidencefordevelopedcountriesissummarizedinHanushek(2003).Fordevelopingcountries,similar
evidenceisfoundinHanushek(1995)andGlewwe,Hanushek,Humpage,andRavina(2013).Thedirectcross‐
countrystudiesareanalyzedinHanushekandWoessmann(2011a).

15
It is useful to look deeper into the relationship between human capital (as measured by
achievement) and growth. To begin with, simply because of the different technologies that are
being employed, the overall relationship between skills and growth may be more important to
OECD countries than in developing countries. Moreover, given the more basic and less
technologically advanced technologies in developing countries, there may a stronger demand for
basic skills and a weaker demand for high level skills in developing countries.
To assess these, Table 4 expands on the modeling of long run growth contained in Table
2. The first column provides a direct test about whether cognitive skills are more important in
developed as opposed to developing countries. The point estimate on the interaction of cognitive
skills and OECD countries is slightly negative – indicating that skills are more important in
developing countries. Nonetheless, the differences are not statistically significant.
The previous growth models have uniformly considered just country-average skills. But,
particularly in developing countries there is often a large variance in performance with some
very high performers and many very low performers (see Hanushek and Woessmann (2008). In
fact, given resource constraints, many developing countries frequently feel it is necessary to
make decisions about whether to spread resources broadly across their population to provide as
great of coverage as possible for its schools or to concentrate resources on those students
identified as the best.
To judge the efficacy of these alternative strategies, it is possible to measure the
proportion of high performers and the proportion with basic literacy as assessed by the cognitive
skills tests.
17
Column (2) of Table 4 provides an estimate of the impact on long run growth of
17
BasicliteracyforthispurposeisascoreonestandarddeviationbelowtheOECDmean.Top‐performingisa
scoreonestandarddeviationabovetheOECDmean.

16
having a broad basic education versus having more high achievers. Importantly, both broad
basic skills (“education for all” in terms of achievement) and high achievers have a separate and
statistically significant impact on long term growth. Interestingly, column (3), which allows for
different impacts in the OECD and nonOECD countries, indicates that high performers are more
important for growth in developing countries than in the OECD countries. This somewhat
surprising result suggests the importance of high skills for adapting more advanced technologies
to developing countries, particularly when the overall proportion of high performers is small.
These estimates of the varied impact of basic literacy and of top-performers, while
suggestive, do not answer the overall policy question about where to invest resources. To
address that question, it is necessary to know more about the relative costs of producing more
basic and more high-performers. In fact, no analysis is available to describe the costs of
producing varying amounts of skills.
An additional issue about the level of investment in developing countries revolves around
the development of tertiary education. A variety of developing countries have contemplated
expanding their systems of higher education, both in terms of broad access institutions (generally
two-year colleges) and higher level institutions. Column (4) provides estimates of the separate
impact of tertiary education on long run growth. Consistent with the prior analysis, once the
level of cognitive skills is considered, years of tertiary schooling – like years of earlier schooling
– in the population has no independent effect on growth. This result also holds for just
developing countries or for just OECD countries (not shown).
18
18
Thisresult,particularlyfordevelopedcountries,issomewhatsurprising.Avarietyofmodelssuchasthoseof
Vandenbussche,Aghion,andMeghir(2006)orAghionandHowitt(2009)suggestthattertiaryeducationis
particularlyimportantforcountriesnearthetechnologicalfrontierwheregrowthrequiresnewinventionsand
innovations.

17
Finally, the form of education institutions is an issue that has not been adequately
addressed, particularly for developing countries. A common issue is how much of education
should be general in nature and how much should be vocational. Vocational education is
designed to provide students with the specific job-related skills that will allow them to move
easily into employment. This type of education appears very attractive when there are large
youth unemployment problems as is the case in many developing countries. But, there may well
be a trade-off with vocational education. If students have a limited set of skills, even if very
appropriate for today’s jobs, they might find that they are less adaptable to new technologies that
are introduced.
19
Such an issue is particularly important for developing countries that frequently
experience very rapid growth and significant changes in production technologies.
Some evidence in developing countries suggests that the tradeoff of easy labor market
entry versus potential disadvantages later in the life cycle because of less adaptability can be
significant (Hanushek, Link, and Woessmann (forthcoming)). Unfortunately, this evidence
comes just from developed countries. No similar analysis exists for developing countries, and it
is unclear whether the tradeoff holds across different development levels.
Issues of Causation
An analytical concern is that the growth relationships discussed do not measure causal
influences but instead reflect reverse causation, omitted variables, cultural differences, and the
like. This concern has been central to the interpretation of much of the prior work in empirical
growth analysis.
19
Inaseriesofmacromodelsofemployeradoptionofnewtechnologies,KruegerandKumar(2004a,(2004b)
suggestthatrelyingonmorevocationaltrainingmayexplainthelowergrowthinEuropeasopposedtotheU.S.

18
An obvious issue is that countries that grow faster have the resources to invest in schools
so that growth could cause higher scores. However, the lack of relationship across countries in
the amount spent on schools and the observed test scores that has been generally found provides
evidence against this (Hanushek and Woessmann (2011a)). Moreover, a variety of sensitivity
analyses show the stability of these results when the estimated models come from varying
country and time samples, varying specific measures of cognitive skills, and alternative other
factors that might affect growth (Hanushek and Woessmann (2012a)). Finally, other work has
considered a series of analyses aimed at eliminating many of the other natural concerns about the
identification of the causal impacts of cognitive skills (Hanushek and Woessmann (2012a)).
20
Each of the analyses points to the plausibility of a causal interpretation of the basic
models. Nonetheless, with our limited international variations, it is difficult to demonstrate
identification conclusively. But, even if the true causal impact of cognitive skills is less than
suggested in Table 1, the overall finding of the importance of such skills is unlikely to be
overturned.
20
Toruleoutsimplereversecausation,HanushekandWoessmann(2012a)separatethetimingoftheanalysisby
estimatingtheeffectofscoresontestsconducteduntiltheearly1980soneconomicgrowthin1980‐2000,finding
anevenlargereffect.Threefurtherdirecttestsofcausalitywerealsodevisedto
ruleoutcertainalternative
explanationsbasedonunobservedcountry‐specificculturesandinstitutionsconfirmtheresults.Thefirstone
considerstheearningsofimmigrantstotheU.S.andfindsthattheinternationaltestscoresfortheirhomecountry
significantlyexplainU.S.earningsbutonlyforthoseeducatedintheirhomecountry
andnotforthoseeducatedin
theU.S.Asecondanalysistakesoutlevelconsiderationsandshowsthatchangesintestscoresovertimeare
systematicallyrelatedtochangesingrowthratesovertime.Athirdcausalityanalysisusesinstitutionalfeaturesof
schoolsystemsasinstrumentalvariablesfortestperformance,
therebyemployingonlythatpartofthevariationin
testoutcomesemanatingfromsuchcountrydifferencesasuseofcentralexams,decentralizeddecisionmaking,
andtheshareofprivatelyoperatedschools.Theseresultssupportacausalinterpretationandalsosuggestthat
schoolingcanbeapolicyinstrumentcontributingtoeconomicoutcomes.
19
Some Conclusions
Much of the motivation for human capital policies in developing countries is the
possibility of providing economic growth that will raise the levels of incomes in these countries.
The focus on alleviating poverty in developing countries relates directly to economic growth
because of the realization that simply redistributing incomes and resources will not lead to long
run solutions to poverty.
The direct analysis of growth in developing countries adds a much more specific focus
than has existed in much of the current policy discussions. Differences in economic growth
across countries are closely related to cognitive skills as measured by achievement on
international assessments of mathematics and science. In fact, once cognitive skills are
incorporated into empirical growth models, school attainment has no independent impact on
growth.
The general focus on universal school attainment underlying the campaigns of Education
for All and Millennium Development Goals, while seemingly reasonable and important, have not
put the developing countries in a good position for growth. Specifically, while emphasizing
school attainment – a readily available quantitative measure – they have not ensured that the
quality of schools has had a commensurate improvement. The data on improvements in school
attainment has been impressive, but the very large gaps in achievement lead to a different
interpretation of progress.

20
In terms of cognitive skills, little closing of the gaps between developed and developing
countries has occurred.
21
A surprisingly large proportion of students completing nine years of
schooling is uncompetitive in terms of international skill levels.
A focus on quality does, however, complicate decision making. It appears to be
generally easier to understand how to expand access than to improve quality. Simple approaches
to improving quality have not proved very effective. Past research has indicated that simply
providing more resources to schools is generally ineffective.
22
Political problems may also
accompany an emphasis on quality. For any given amount of funds, if resources are focused on
a smaller set of schools in order to improve quality, it implies that less access to schooling can be
provided.
Certainly, in order to provide quality schooling, there must be both infrastructure and
access. However, the evidence from the growth analysis indicates that providing schools that fail
to teach basic skills does no good. Therefore, slowing the pace of the provision of schools to a
rate that also permits the development of quality schools appears to be a good solution.
One other element enters into the calculations. The rapid expansion of new digital
technologies – both as blended learning with teachers and technology and as standalone
approaches – suggests that many of the past decisions both on access and on quality might
rapidly change.
23
The potential in developing countries appears especially large.
21
Whilesomedevelopingcountrieshavemadesignificantgainsinachievement–e.g.,Latvia,Chile,andBrazil–
thereislittleoveralltendencyfordevelopingcountriestogainmorethandevelopedcountriesoninternational
assessments(Hanushek,Peterson,andWoessmann(2012)).
22
Hanushek(1995),HanushekandWoessmann(2011a),Glewwe,Hanushek,Humpage,andRavina(2013).
23
Christensen,Horn,andJohnson(2008).
21
Acknowledgements: This analysis is closely related to work on international growth an development
done jointly with Ludger Woessmann. Helpful comments were received from Bruce Chapman and the
participants at the ANU-DPU International Conference on the Economics of Education Policy.
22
References
Aghion, Philippe, and Peter Howitt. 2009. The economics of growth. Cambridge, MA: MIT Press.
Barro, Robert J. 1991. "Economic growth in a cross section of countries." Quarterly Journal of
Economics 106, no. 2 (May): 407-443.
Barro, Robert J., and Jong-Wha Lee. 1993. "International comparisons of educational attainment."
Journal of Monetary Economics 32, no. 3 (December): 363-394.
Barro, Robert J., and Jong-Wha Lee. 2010. "A new data set of educational attainment in the world, 1950-
2010." NBER Working Paper 15902. Cambridge, MA: National Bureau of Economic Research
(April).
Becker, Gary S. 1964. Human capital: A theoretical and empirical analysis, with special reference to
education. New York, NY: National Bureau of Economic Research.
Bils, Mark, and Peter J. Klenow. 2000. "Does schooling cause growth?" American Economic Review 90,
no. 5 (December): 1160-1183.
Bloom, David E., David Canning, and Dean T. Jamison. 2004. "Health, wealth and welfare." Finance and
Development 41, no. 1 (March): 10-15.
Bundy, D. 2005. "School health and nutrition: Policy and programs." Food and Nutrition Bulletin 26, no.
2 (Supplement 2) (June): S186 - S192.
Christensen, Clayton M., Michael B. Horn, and Curtis W. Johnson. 2008. Disrupting class: How
disruptive innovation will change the way the world learns. New York: McGraw-Hill Book
Company.
Cohen, Daniel, and Marcelo Soto. 2007. "Growth and human capital: good data, good results." Journal of
Economic Growth 12, no. 1 (March): 51-76.
Easterly, William. 2001. The elusive quest for growth: An economist's adventures and misadventures in
the tropics. Cambridge, MA: The MIT Press.
Glewwe, Paul, Eric A. Hanushek, Sarah D. Humpage, and Renato Ravina. 2013. "School resources and
educational outcomes in developing countries: A review of the literature from 1990 to 2010." In
Education Policy in Developing Countries, edited by Paul Glewwe. Chicago: University of
Chicago Press.
Gomes-Neto, João Batista, Eric A. Hanushek, Raimundo Hélio Leite, and Roberto Cláudio Frota-Bezzera.
1997. "Health and schooling: Evidence and policy implications for developing countries."
Economics of Education Review 16, no. 3 (June): 271-282.
Hanushek, Eric A. 1995. "Interpreting recent research on schooling in developing countries." World Bank
Research Observer 10, no. 2 (August): 227-246.
Hanushek, Eric A. 2002. "Publicly provided education." In Handbook of Public Economics, Vol. 4, edited
by Alan J. Auerbach and Martin Feldstein. Amsterdam: North Holland: 2045-2141.
Hanushek, Eric A. 2003. "The failure of input-based schooling policies." Economic Journal 113, no. 485
(February): F64-F98.
Hanushek, Eric A., and Dennis D. Kimko. 2000. "Schooling, labor force quality, and the growth of
nations." American Economic Review 90, no. 5 (December): 1184-1208.
23
Hanushek, Eric A., Susanne Link, and Ludger Woessmann. forthcoming. "Does school autonomy make
sense everywhere? Panel estimates from PISA." Journal of Development Economics:
forthcoming.
Hanushek, Eric A., Paul E. Peterson, and Ludger Woessmann. 2012. "Is the U.S. catching up?
International and state trends in student achievement." Education Next 12, no. 3 (Fall): 32-41.
Hanushek, Eric A., and Ludger Woessmann. 2008. "The role of cognitive skills in economic
development." Journal of Economic Literature 46, no. 3 (September): 607-668.
Hanushek, Eric A., and Ludger Woessmann. 2011a. "The economics of international differences in
educational achievement." In Handbook of the Economics of Education, Vol. 3, edited by Eric A.
Hanushek, Stephen Machin, and Ludger Woessmann. Amsterdam: North Holland: 89-200.
Hanushek, Eric A., and Ludger Woessmann. 2011b. "How much do educational outcomes matter in
OECD countries?" Economic Policy 26, no. 67 (July): 427-491.
Hanushek, Eric A., and Ludger Woessmann. 2012a. "Do better schools lead to more growth? Cognitive
skills, economic outcomes, and causation." Journal of Economic Growth 17, no. 4 (December):
267-321.
Hanushek, Eric A., and Ludger Woessmann. 2012b. "Schooling, educational achievement, and the Latin
American growth puzzle." Journal of Development Economics 99, no. 2 (November): 497–512.
Krueger, Dirk, and Krishna B. Kumar. 2004a. "Skill-specific rather than general education: A reason for
US-Europe growth differences?" Journal of Economic Growth 9, no. 2: 167-207.
Krueger, Dirk, and Krishna B. Kumar. 2004b. "US-Europe differences in technology-driven growth:
quantifying the role of education." Journal of Monetary Economics 51, no. 1 (January): 161-190.
Levine, Ross, and David Renelt. 1992. "A sensitivity analysis of cross-country growth regressions."
American Economic Review 82, no. 4 (September): 942-963.
Mankiw, N. Gregory, David Romer, and David Weil. 1992. "A contribution to the empirics of economic
growth." Quarterly Journal of Economics 107, no. 2 (May): 407-437.
Marshall, Alfred. 1898. Principles of economics. Vol. 1. London: Macmillan and Company.
Miguel, Edward, and Michael Kremer. 2004. "Worms: Identifying Impacts on Education and Health in
the Presence of Treatment Externalities." Econometrica 72, no. 1: 159-217.
Mincer, Jacob. 1970. "The distribution of labor incomes: a survey with special reference to the human
capital approach." Journal of Economic Literature 8, no. 1 (March): 1-26.
Mincer, Jacob. 1974. Schooling, experience, and earnings. New York: NBER.
Organisation for Economic Co-operation and Development. 2010. PISA 2009 Results: What Students
Know and Can Do – Student Performance in Reading, Mathematics and Science (Volume I).
Paris: OECD.
Petty, Sir William. 1676 [1899]. "Political arithmetic." In The economic writings of Sir William Petty,
edited by Charles Henry Hull. Cambridge, UK: Cambridge University Press: 233-313.
Pritchett, Lant. 2006. "Does learning to add up add up? The returns to schooling in aggregate data." In
Handbook of the Economics of Education, edited by Eric A. Hanushek and Finis Welch.
Amsterdam: North Holland: 635-695.
Psacharopoulos, George, and Harry A. Patrinos. 2004. "Returns to investment in education: a further
update." Education Economics 12, no. 2 (August): 111-134.
24
Romer, Paul. 1990. "Endogenous technological change." Journal of Political Economy 99, no. 5,pt. II:
S71-S102.
Schultz, Theodore W. 1961. "Investment in human capital." American Economic Review 51, no. 1
(March): 1-17.
Smith, Adam. [1776]1979. An inquiry into the nature and causes of the wealth of nations. Oxford:
Clarendon Press.
UNESCO. 2006. Literacy for life: EFA Global monitoring report. Paris: UNESCO.
———. 2011. The hidden crisis: Armed conflict and educaiton. Paris: UNESCO.
Vandenbussche, Jérôme, Philippe Aghion, and Costas Meghir. 2006. "Growth, distance to frontier and
composition of human capital." Journal of Economic Growth 11, no. 2 (June): 97-127.

Table 1. Alternative Estimates of Long Run Growth Models
Dependent variable: average annual growth in GDP per capita, 1960-2000
(1) (2) (3)
Cognitive skills (A) 2.015 1.980
(10.68) (9.12)
Years of schooling 1960
(S)
0.369 0.026
(3.23) (0.34)
GDP per capita 1960 -0.379 -0.287 -0.302
(4.24) (9.15) (5.54)
No. of countries 50 50 50
R
2
(adj.) 0.252 0.733 0.728
Notes: Dependent variable: average annual growth rate in GDP per capita, 1960-2000. Regressions include a
constant. t-statistics in parentheses.
Source: Hanushek and Woessmann (2012a)

Table 2. Expansion of Primary Education
1991 1999 2008
Net Enrollment in primary school
Developed 96.2 96.6 95
Countries in transition 89.0 85.4 (89)
a
91
Developing 79.5 83.2 (80)
a
87
School Expectancy
Developed 14.2 15.7 15.9
Countries in transition 12.2 11.9 13.5
Developing 8.4 9.1 10.4
Note: a. Alternative estimate from UNESCO (2011) as opposed to UNESCO (2006).
Source: UNESCO (2006), UNESCO (2011)

Table 3. Performance at or below Level 1 on the PISA Mathematics Assessment, 2009: Selected
countries (percent)
Source: Organisation for Economic Co-operation and Development (2010)
below level 1 Level 1 Level 1 or less
Kyrgyzstan
64.8 21.8 86.6
Panama
51.5 27.3 78.8
Indonesia
43.5 33.1 76.7
Qatar
51.1 22.7 73.8
Tunisia
43.4 30.2 73.6
Peru
47.6 25.9 73.5
Colombia
38.8 31.6 70.4
Brazil
38.1 31.0 69.1
Albania
40.5 27.2 67.7
Jordan
35.4 29.9 65.3
Argentina
37.2 26.4 63.6
Kazakhstan
29.6 29.6 59.1
Montenegro
29.6 28.8 58.4
Trinidad and Tobago
30.1 23.1 53.2
Thailand
22.1 30.4 52.5
Uruguay
22.9 24.6 47.6
Bulgaria
24.5 22.7 47.1
Romania
19.5 27.5 47.0
Azerbaijan
11.5 33.8 45.3
Serbia
17.6 22.9 40.6

Table 4. Extensions of Basic Models for Developing Countries
(1) (2) (3) (4)
Cognitive skills 1.978
1.923
(7.98)
(9.12)
Share of students reaching 2.644 2.146
basic literacy
(3.51) (2.58)
Share of top-performing 12.602 16.536
students
(4.35) (4.90)
OECD 0.859
-0.659
(0.32)
(0.44)
OECD x Cognitive skills -0.203
(0.36)
OECD x basic literacy 2.074
(0.94)
OECD x top-performing -13.422
(2.08)
Years of non-tertiary schooling
0.076
(0.94)
Years of tertiary schooling
0.198
(0.16)
Initial years of schooling 0.080 0.066 0.070
(1.07) (0.87) (0.94)
Initial GDP per capita -0.313 -0.305 -0.317 -0.325
(5.61) (6.43) (5.63) (6.81)
No. of countries 50 50 50 50
F (OECD and interaction) 0.10 1.62
R
2
(adj.) 0.723 0.724 0.734
0.728
Notes: Dependent variable: average annual growth rate in GDP per capita, 1960-2000. Regressions include a constant. t-
statistics in parentheses. Basic literacy is a score of 400 or above on the PISA scale, which is one standard deviation below the
OECD mean. To-performing is a score of 600 or above on the PISA scale, which is one standard deviation above the OECD
mean.
Source: Hanushek and Woessmann (2011b)
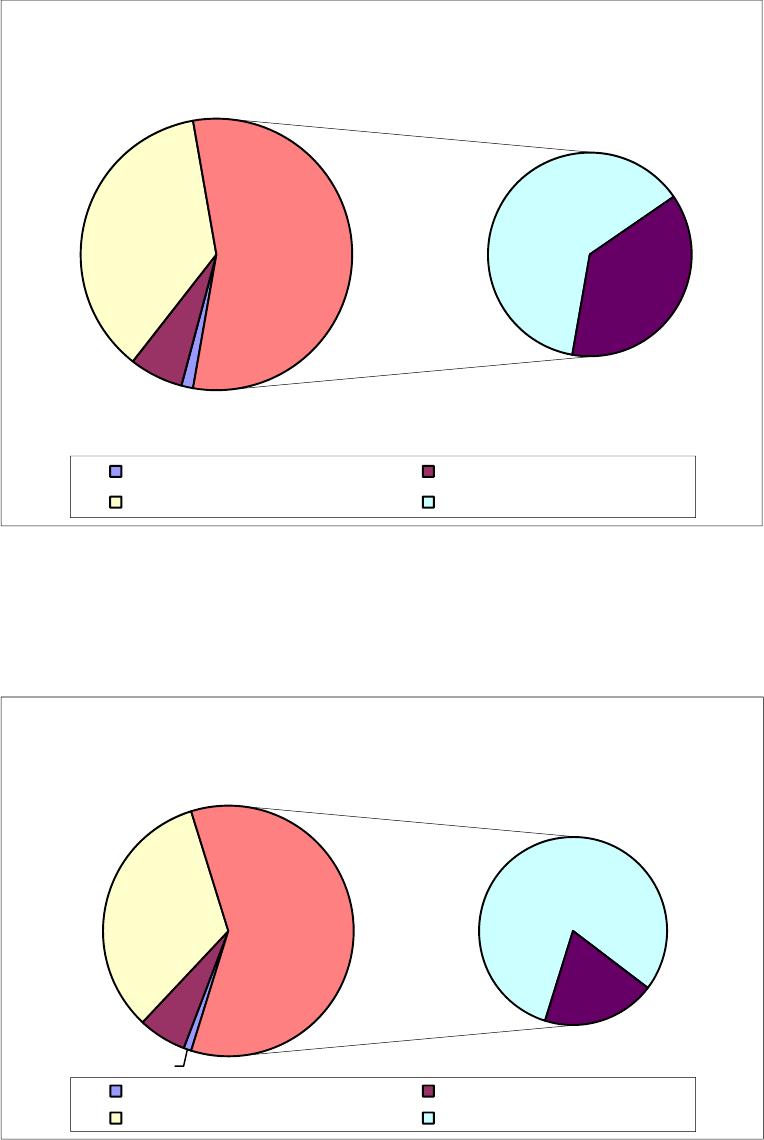
Figure 1. Combined Completion and Achievement Outcomes, Selected Countries
1%
6%
37%
35%
21%
56%
Philippines
never enrolled dropout gr 1-5
dropout gr 6-9 finish gr 9 -- not literate
1%
6%
33%
48%
12%
60%
Peru
never enrolled dropout gr 1-5
dropout gr 6-9 finish gr 9 -- not literate
Figure 1(cont.). Combined Completion and Achievement Outcomes, Selected Countries
1%
6%
46%
39%
7%
46%
South Africa
never enrolled dropout gr 1-5
dropout gr 6-9 finish gr 9 -- not literate
literate at grade 9
