
Country classification
Data sources, country classifications and aggregation
methodology
e statistical annex contains a set of data that the World Economic Situation and Prospects
(WESP) employs to delineate trends in various dimensions of the world economy.
Data sources
e annex was prepared by the Development Policy and Analysis Division (DPAD) of the
Department of Economic and Social Aairs of the United Nations Secretariat (UN/DESA).
It is based on information obtained from the Statistics Division and the Population Division
of UN/DESA, as well as from the ve United Nations regional commissions, the United Na
-
tions Conference on Trade and Development (UNCTAD), the United Nations World Tour-
ism Organization (UNWTO), the International Monetary Fund (IMF), the World Bank,
t
he Organization for Economic Cooperation and Development (OECD), and national and
private sources. Estimates for the most recent years were made by DPAD in consultation
with the regional commissions, UNCTAD, UNWTO and participants in Project LINK,
an international collaborative research group for econometric modelling coordinated jointly
by DPAD and the University of Toronto. Forecasts for 2014 and 2015 are primarily based
on the World Economic Forecasting Model of DPAD, with support from Project LINK.
Data presented in WESP may dier from those published by other organizations for
a series of reasons, including dierences in timing, sample composition and aggregation
methods. Historical data may dier from those in previous editions of WESP because of
updating and changes in the availability of data for individual countries.
Country classifications
For analytical purposes, WESP classies all countries of the world into one of three broad
categories: developed economies, economies in transition and developing economies. e
composition of these groupings, specied in tables A, B and C, is intended to reect basic
economic country conditions. Several countries (in particular the economies in transition)
have characteristics that could place them in more than one category; however, for purposes
of analysis, the groupings have been made mutually exclusive. Within each broad category,
some subgroups are dened based either on geographical location or on ad hoc criteria, such
as the subgroup of “major developed economies”, which is based on the membership of the
Group of Seven. Geographical regions for developing economies are as follows: Africa, East
Asia, South Asia, Western Asia, and Latin America and the Caribbean.
1
1 Names and composition of geographical areas follow those specied in the statistical paper entitled
“Standard country or area codes for statistical use” (ST/ESA/STAT/SER.M/49/Rev. 4).

144 World Economic Situation and Prospects 2014
In parts of the analysis, a distinction is made between fuel exporters and fuel
importers from among the economies in transition and the developing countries. An
economy is classied as a fuel exporter if the share of fuel exports in its total merchandise
exports is greater than 20 per cent and the level of fuel exports is at least 20 per cent
higher than that of the country’s fuel imports. is criterion is drawn from the share
of fuel exports in the total value of world merchandise trade. Fuels include coal, oil and
natural gas (table D).
For other parts of the analysis, countries have been classied by their level of devel
-
opment as measured by per capita gross national income (GNI). Accordingly, countries
h
ave been grouped as high-income, upper middle income, lower middle income and
low-income (table E). To maintain compatibility with similar classications used else
-
where, the threshold levels of GNI per capita are those established by the World Bank.
C
ountries with less than $1,035 GNI per capita are classied as low-income countries,
those with between $1,036 and $4,085 as lower middle income countries, those with
between $4,086 and $12,615 as upper middle income countries, and those with incomes
of more than $12,615 as high-income countries. GNI per capita in dollar terms is esti
-
mated using the World Bank Atlas method,
2
and the classication in table E is based on
data for 2012.
e list of the least developed countries (LDCs) is decided upon by the United
Nations Economic and Social Council and, ultimately, by the General Assembly, on the
basis of recommendations made by the Committee for Development Policy. e basic
criteria for inclusion require that certain thresholds be met with regard to per capita GNI,
a human assets index and an economic vulnerability index.
3
As at 29 November 2013,
there were 49 LDCs (table F).
WESP also makes reference to the group of heavily indebted poor countries (HIPCs),
which are considered by the World Bank and IMF as part of their debt-relief initiative
(the Enhanced HIPC Initiative).
4
In September 2013, there were 39 HIPCs (see table G).
Aggregation methodology
Aggregate data are either sums or weighted averages of individual country data. Unless
otherwise indicated, multi-year averages of growth rates are expressed as compound an-
nual percentage rates of change. e convention followed is to omit the base year in a
m
ulti-year growth rate. For example, the 10-year average growth rate for the decade of
the 2000s would be identied as the average annual growth rate for the period from 2001
to 2010.
WESP utilizes exchange-rate conversions of national data in order to aggregate
output of individual countries into regional and global totals. e growth of output in
each group of countries is calculated from the sum of gross domestic product (GDP)
of individual countries measured at 2005 prices and exchange rates. Data for GDP in
2 See http://data.worldbank.org/about/country-classications.
3 Handbook on the Least Developed Country Category: Inclusion, Graduation and Special Support Measures
(United Nations publication, Sales No. E.07.II.A.9). Available from http://www.un.org/esa/analysis/
devplan/cdppublications/2008cdphandbook.pdf.
4 IMF, Debt Relief Under the Heavily Indebted Poor Countries (HIPC) Initiative Available from
http://www.imf.org/external/np/exr/facts/pdf/hipc.pdf

145Country classification
2005 in national currencies were converted into dollars (with selected adjustments) and
extended forwards and backwards in time using changes in real GDP for each country.
is method supplies a reasonable set of aggregate growth rates for a period of about 15
years, centred on 2005.
e exchange-rate based method diers from the one mainly applied by the IMF
and the World Bank for their estimates of world and regional economic growth, which is
based on purchasing power parity (PPP) weights. Over the past two decades, the growth
of world gross product (WGP) on the basis of the exchange-rate based approach has been
below that based on PPP weights. is is because developing countries, in the aggregate,
have seen signicantly higher economic growth than the rest of the world in the 1990s
and 2000s and the share in WGP of these countries is larger under PPP measurements
than under market exchange rates.
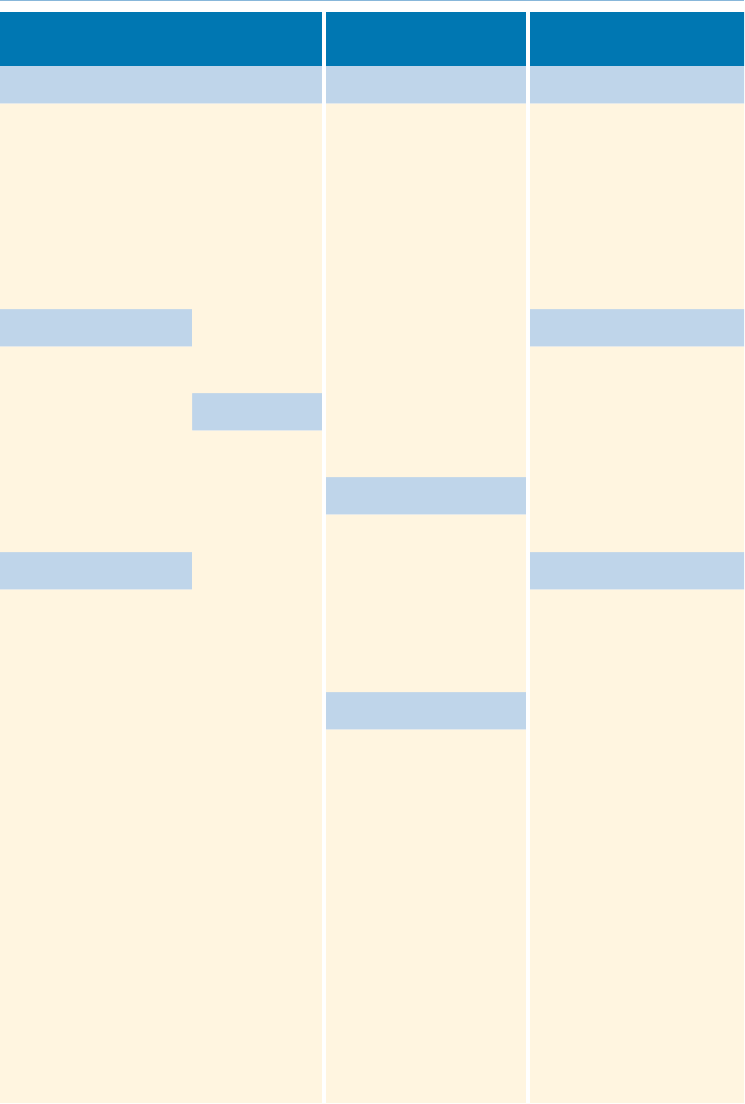
Table A
Developed economies
Europe
Other countries
Major developed
economies (G7)European Union New EU member States Other Europe
EU-15
Austria
Belgium
Denmark
Finland
France
Germany
Greece
Ireland
Italy
Luxembourg
Netherlands
Portugal
Spain
Sweden
United Kingdom
Bulgaria
Croatia
Cyprus
Czech Republic
Estonia
Hungary
Latvia
Lithuania
Malta
Poland
Romania
Slovakia
Slovenia
Iceland
Norway
Switzerland
Australia
Canada
Japan
New Zealand
United States
Canada
Japan
France
Germany
Italy
United Kingdom
United States
Table B
Economies in transition
South-Eastern Europe Commonwealth of Independent States and Georgia
a
Albania
Bosnia and Herzegovina
Montenegro
Serbia
The former Yugoslav Republic
of Macedonia
Armenia
Azerbaijan
Belarus
Georgia
a
Kazakhstan
Kyrgyzstan
Republic of Moldova
Russian Federation
Tajikistan
Turkmenistan
Ukraine
Uzbekistan
a Georgia officially left the
Commonwealth of Independent
States on 18 August 2009.
However, its performance is
discussed in the context of this
group of countries for reasons
of geographic proximity
and similarities in economic
structure.
146 World Economic Situation and Prospects 2014
Table C
Developing economies by region
a
Africa Asia
Latin America
and the Caribbean
North Africa Southern Africa East Asia Caribbean
Algeria
Egypt
Libya
b
Mauritania
Morocco
Sudan
Tunisia
Angola
Botswana
Lesotho
Malawi
Mauritius
Mozambique
Namibia
South Africa
Zambia
Zimbabwe
Brunei Darussalam
China
Hong Kong SAR
c
Indonesia
Malaysia
Myanmar
Papua New Guinea
Philippines
Republic of Korea
Singapore
Taiwan Province of China
Thailand
Viet Nam
Barbados
Cuba
Dominican Republic
Guyana
Haiti
Jamaica
Trinidad and Tobago
Central Africa Mexico and Central America
Cameroon
Central African Republic
Chad
Congo
Equatorial Guinea
Gabon
Sao Tome and Prinicipe
Costa Rica
El Salvador
Guatemala
Honduras
Mexico
Nicaragua
Panama
West Africa
Benin
Burkina Faso
Cabo Verde
Côte d’Ivoire
Gambia
Ghana
Guinea
Guinea-Bissau
Liberia
Mali
Niger
Nigeria
Senegal
Sierra Leone
Togo
South Asia
Bangladesh
India
Iran (Islamic Republic of)
Nepal
Pakistan
Sri Lanka
East Africa South America
Burundi
Comoros
Democratic Republic
ofthe Congo
Djibouti
Eritrea
Ethiopia
Kenya
Madagascar
Rwanda
Somalia
Uganda
United Republic
ofTanzania
Argentina
Bolivia (Plurinational
State of)
Brazil
Chile
Colombia
Ecuador
Paraguay
Peru
Uruguay
Venezuela (Bolivarian
Republic of)
Western Asia
Bahrain
Iraq
Israel
Jordan
Kuwait
Lebanon
Oman
Qatar
Saudi Arabia
Syrian Arab Repuplic
Turkey
United Arab Emirates
Yemen
a Economies systematically
monitored by the Global
Economic Monitoring Unit
ofDPAD.
b The name of the Libyan
Arab Jamahiriya was officially
changed to Libya on 16
September 2011.
c Special Administrative
Regionof China.

147Country classification
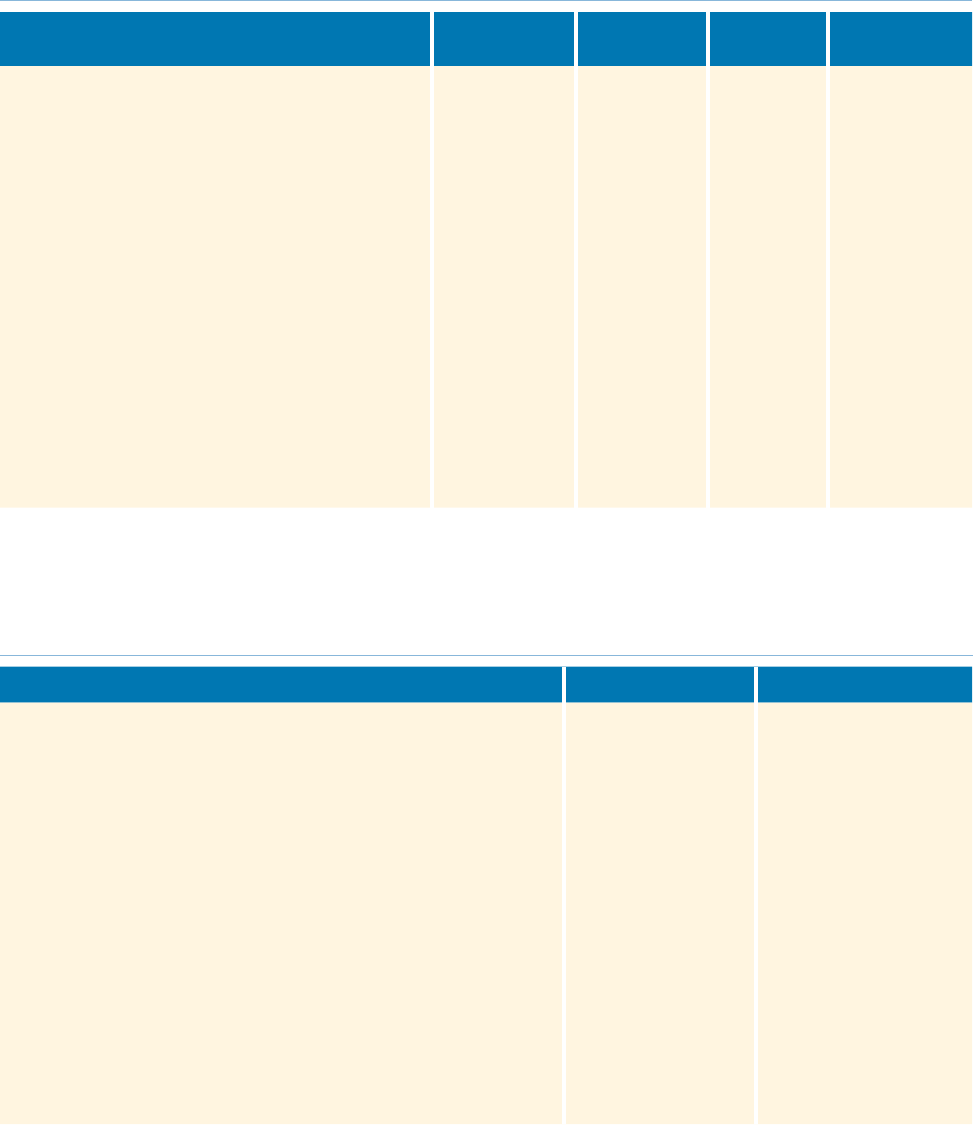
Table D
Fuel-exporting countries
Economies
in transition
Developing countries
Latin America
and the Caribbean Africa East Asia South Asia Western Asia
Azerbaijan
Kazakhstan
Russian
Federation
Turkmenistan
Uzbekistan
Bolivia
(Plurinational
State of)
Colombia
Ecuador
Trinidad
and Tobago
Venezuela
(Bolivarian
Republic of)
Algeria
Angola
Cameroon
Chad
Congo
Côte d’Ivoire
Egypt
Equatorial
Guinea
Gabon
Libya
Nigeria
Sudan
Brunei
Darussalam
Indonesia
Viet Nam
Iran (Islamic
Republic of)
Bahrain
Iraq
Kuwait
Oman
Qatar
Saudi Arabia
United Arab
Emirates
Yemen

148 World Economic Situation and Prospects 2014
Table E
Economies by per capita GNI in 2012
a
High-income Upper middle income Lower middle income Low-income
Australia
Austria
Bahrain
Barbados
Belgium
Brunei
Darussalam
Canada
Chile
b
Croatia
Cyprus
Czech
Republic
Denmark
Equatorial
Guinea
Estonia
Finland
France
Germany
Greece
Hong Kong
SAR
d
Iceland
Ireland
Israel
Italy
Japan
Kuwait
Latvia
b
Lithuania
b
Luxembourg
Malta
Netherlands
New Zealand
Norway
Oman
Poland
Portugal
Qatar
Republic
of Korea
Russian Federation
b
Saudi Arabia
Singapore
Slovak
Republic
Slovenia
Spain
Sweden
Switzerland
Taiwan Province
of China
Trinidad and
Tobago
United Arab
Emirates
United Kingdom
United States
Uruguay
b
Albania
b
Algeria
Angola
Argentina
Azerbaijan
Belarus
Bosnia and
Herzegovina
Botswana
Brazil
Bulgaria
China
Colombia
Costa Rica
Cuba
Dominican
Republic
Ecuador
Gabon
Hungary
c
Iran, Islamic
Republic
Iraq
b
Jamaica
Jordan
Kazakhstan
Lebanon
Libya
Malaysia
Mauritius
Mexico
Montenegro
Namibia
Panama
Peru
Romania
Serbia
South Africa
Thailand
The former
Yugoslav
Republc of
Macedonia
Tunisia
Turkey
Turkmenistan
Venezuela, RB
Armenia
Bolivia
Cameroon
Cape Verde
Congo
Côte d’Ivoire
Djibouti
Egypt
El Salvador
Georgia
Ghana
Guatemala
Guyana
Honduras
India
Indonesia
Lesotho
Mauritania
b
Moldova
Morocco
Nicaragua
Nigeria
Pakistan
Papua New Guinea
Paraguay
Philippines
São Tomé and
Principe
Senegal
Sri Lanka
Sudan
Syrian Arab Republic
Ukraine
Uzbekistan
Vietnam
Yemen, Rep.
Zambia
Bangladesh
Benin
Burkina Faso
Burundi
Central African
Republic
Chad
Comoros
Democratic Republic
of the Congo
Eritrea
Ethiopia
Gambia, The
Guinea
Guinea-Bissau
Haiti
Kenya
Kyrgyz Republic
Liberia
Madagascar
Malawi
Mali
Mozambique
Myanmar
Nepal
Niger
Rwanda
Sierra Leone
Somalia
Tajikistan
Tanzania
Togo
Uganda
Zimbabwe
a Economies systematically monitored for the World Economic Situation and Prospects report and included in the United Nations’ global economic forecast.
b Indicates the country has been shifted upward by one category from previous year’s classification.
c Indicates the country has been shifted downward by one category from previous year’s classification.
d Special Administrative Region of China.
149Country classification
Table F
Least developed countries (as of November 2013)
Africa East Asia South Asia Western Asia
Latin America
& the Caribbean
Angola
Benin
Burkina Faso
Burundi
Central African Republic
Chad
Comoros
Democratic Republic of the
Congo
Djibouti
Equatorial Guinea
Eritrea
Ethiopia
Gambia
Guinea
Guinea-Bissau
Lesotho
Liberia
Madagascar
Malawi
Mali
Mauritania
Mozambique
Niger
Rwanda
Sao Tome and Principe
Senegal
Sierra Leone
Somalia
South Sudan
a
Sudan
Togo
Uganda
United Republic
of Tanzania
Zambia
Cambodia
a
Kiribati
a
Lao People’s
Democratic
Republic
a
Myanmar
Samoa
a, b
Solomon
Islands
a
Timor Leste
a
Tuvalu
a
Vanuatu
a
Afghanistan
a
Bangladesh
Bhutan
a
Nepal
Yemen Haiti
a Not included in the WESP discussion because of insufficient data.
b Samoa will graduate from the list of the least developed countries in January 2014.
Table G
Heavily indebted poor countries (as of September 2013)
Post-completion point HIPCs
a
Interim HIPCs
b
Pre-decision point HIPCs
c
Afghanistan
Benin
Bolivia
Burkina Faso
Burundi
Cameroon
Central African Republic
Congo
Côte D’Ivoire
Democratic Republic of the Congo
Ethiopia
Gambia
Ghana
Guinea
Guinea-Bissau
Guyana
Haiti
Honduras
Liberia
Madagascar
Malawi
Mali
Mauritania
Mozambique
Nicaragua
Niger
Rwanda
Sao Tome and Principe
Senegal
Sierra Leone
Togo
Uganda
United Republic of Tanzania
Zambia
Chad
Comoros
Eritrea
Somalia
Sudan
a Countries that have qualified for irrevocable debt relief under the HIPC Initiative.
b Countries that have qualified for assistance under the HIPC Initiative (that is to say, have reached decision point), but have not yet reached completion point.
c Countries that are potentially eligible and may wish to avail themselves of the HIPC Initiative or the Multilateral Debt Relief Initiative (MDRI).

150 World Economic Situation and Prospects 2014
Table H
Small island developing States
United Nations members
Non-UN Members/Associate Members
of the Regional Commissions
Antigua and Barbuda
Bahamas
Bahrain
Barbados
Belize
Cabo Verde
Comoros
Cuba
Dominica
Dominican Republic
Federated States of
Micronesia
Fiji
Grenada
Guinea-Bissau
Guyana
Haiti
Jamaica
Kiribati
Maldives
Marshall Islands
Mauritius
Nauru
Palau
Papua New Guinea
Saint Kitts and Nevis
Saint. Lucia
Saint Vincent and the
Grenadines
Samoa
São Tomé and Príncipe
Seychelles
Singapore
Solomon Islands
Suriname
Timor-Leste
Tonga
Trinidad and Tobago
Tuvalu
Vanuatu
American Samoa
Anguilla
Aruba
Bermuda
British Virgin Islands
Cayman Islands
Commonwealth of Northern
Marianas
Cook Islands
Curacao
French Polynesia
Guadeloupe
Guam
Martinique
Montserrat
New Caledonia
Niue
Puerto Rico
Turks and Caicos Islands
U.S. Virgin Islands
Table I
Landlocked developing countries
Landlocked developing countries
Afghanistan
Armenia
Azerbaijan
Bhutan
Bolivia (Plurinational State of)
Botswana
Burkina Faso
Burundi
Central African Republic
Chad
Ethiopia
Kazakhstan
Kyrgystan
Lao People’s Democratic
Republic
Lesotho
Malawi
American Samoa
Anguilla
Aruba
Bermuda
British Virgin Islands
Cayman Islands
Commonwealth of Northern
Marianas
Cook Islands
Curacao
French Polynesia
Mali
Republic of Moldova
Mongolia
Nepal
Niger
Paraguay
Rwanda
South Sudan
Swaziland
Tajikistan
The former Yugoslav Republic
of Macedonia
Turkmenistan
Uganda
Uzbekistan
Zambia
Zimbabwe
