FactSheet
••
•
Medicaid and
CHIP
Payment
and Access Commission
1800 M Street
NW
Suite 650 South
Washington,
DC
20036
(Q}
MACPAC
www.macpac.gov
202-350-2000 l
202-273-2452
1B
June 2021 Advising Congress on Medicaid and CHIP Policy
Physician Acceptance of New Medicaid Patients:
Findings from the National Electronic Health
Records Survey
The availability of providers is a key factor affecting access to care for Medicaid enrollees. Prior MACPAC
analysis, using the National Ambulatory Medical Care Survey (NAMCS), found that physicians were less
likely to accept new patients insured by Medicaid (70.8 percent) compared to those with Medicare (85.3
percent) or private insurance (90.0 percent). This finding was consistent across specialties with the
exception of pediatricians. The analysis also suggested that provider acceptance of new Medicaid patients
varied by state. For example, obstetrician/gynecologists accepted new Medicaid patients at higher rates in
states that did not adopt the Medicaid expansion created by the Patient Protection and Affordable Care Act
(ACA, P.L. 111-148, as amended) (89.6 percent) than in states that expanded (73.9 percent). In addition,
controlling for other factors, states with higher Medicaid-to-Medicare fee ratios had higher Medicaid
acceptance among physicians (MACPAC 2019).
This fact sheet provides updated analysis of physician acceptance of new Medicaid patients, including at a
state-level, using data from the National Electronic Health Records Survey (NEHRS). It begins by describing
the approach used to conduct the analysis. It then discusses the high-level findings. The fact sheet then
presents more detailed national and state-level estimates of physician acceptance of new Medicaid patients
by certain characteristics.
Approach
Although provider participation in Medicaid has been studied at the national level, there is little information
on physician participation at the state level. State-level statistics are of interest given variation in how states
design and operate their Medicaid programs. This study, conducted under contract with the State Health
Access Data Assistance Center (SHADAC) at the University of Minnesota, examines rates of physician
acceptance of new Medicaid patients by state, and the association of acceptance with various practice
characteristics. We analyzed physician acceptance of new patients by source of coverage (comparing
Medicaid to Medicare and private coverage), as well as acceptance by Medicaid caseload, presence of mid-
level providers (such as nurse practitioners and physician assistants), and practice setting (including private
practices, various types of clinics, health management organization (HMO) practices, and faculty practices).
The data for this study are from the NEHRS, a nationally representative, mixed-mode survey of nonfederal,
office-based physicians conducted by the National Center for Health Statistics (NCHS) at the Centers for
Disease Control and Prevention. The NEHRS has been collecting data on an annual basis since 2008 and
in 2010, the sample size was increased to allow for state-level estimates, which are not possible with
NAMCS.
1
The 2010–2017 NEHRS microdata were accessed through the Minnesota Research Data Center.
The NEHRS asks physicians if they accept new patients and, if so, whether they accept Medicaid as a
payment source for these new patients. Data from 2011–2013 and 2014–2017 were pooled where single-

•••
Medicaid and
CHIP
Payment
and Access Commission
www
.macpac.gov
2
year estimates were not possible due to insufficient sample size or statistical reliability. NCHS did not
release data from 2016; 2012 and 2013 data were unavailable for certain variables.
2
Findings
Similar to prior analysis, physicians were significantly less likely to accept new patients covered by Medicaid
than those with Medicare or private insurance, although acceptance varied by specialty and by state.
Medicaid acceptance was much higher among physicians practicing in most clinic settings compared to the
average for all settings. Physicians in faculty practice plans and HMO practices also accepted Medicaid
patients at above average rates. Physicians with higher than average existing Medicaid caseloads accepted
new Medicaid patients at higher rates. The presence of mid-level providers was also associated with greater
acceptance of new Medicaid patients.
Acceptance by patient source of coverage
In 2017 (the most recent year available), physicians were significantly less likely to accept new patients
insured by Medicaid (74.3 percent) than those with Medicare (87.8 percent) or private insurance (96.1
percent) (Table 1). Consistent with our previous analysis and those of other researchers, this was true
regardless of physician demographic characteristics (age, sex, region of the country); and type and size of
practice.
3
A few notable differences were found in comparing particular specialties to the overall acceptance rate.
Obstetrician/gynecologists accepted new Medicaid patients at approximately the same rate (81.7 percent)
as new Medicare patients (88.7 percent), but significantly less than privately insured patients (98.9 percent).
Pediatricians accepted new Medicaid patients significantly less (84.7 percent) than privately insured patients
(97.6 percent), but significantly more than new Medicare patients (39.1 percent), which is expected given the
population generally served by Medicare.
TABLE 1. Percentage of Physicians Accepting Payments for New Patients by Specialty and Coverage Type,
2017
Specialty
Medicaid
Medicare
Private
Total
74.3%
87.8%
*
96.1%
*
Broad
Primary care
75.8
80.6
96.8
*
Surgical/medical care
72.9
93.8
*
95.5
*
Specific
Dermatology
46.2
97.7
*
98.0
*
General/family practice
76.0
93.6
*
94.0
*
General surgery
87.5
95.9
99.6
Internal medicine
62.9
95.2
*
98.8
*
Obstetrics and gynecology
81.7
88.7
98.9
*
Ophthalmology
77.4
―
―
Orthopedic surgery
85.8
99.1
*
99.2
*
Other specialties
70.0
92.8
*
96.0
*
•••
Medicaid and
CHIP
Payment
and Access Commission
www
.macpac.gov
3
Specialty
Medicaid
Medicare
Private
Pediatrics
84.7
39.1
*
97.6
*
Psychiatry
45.5
74.6
*
69.2
Notes: Estimates are among physicians accepting any new patients.
* indicates a statistically significant difference from Medicaid at the 0.05 level.
― indicates estimate is unreliable because it has a relative standard error greater than or equal to 30 percent.
Source: MACPAC and State Health Access Data Assistance Center (SHADAC) analysis of 2017 National Electronic Health Records
Survey (NEHRS) data.
Physician acceptance has been relatively consistent over time (Table 2). When pooling years, providers
were similarly less likely to accept new patients insured by Medicaid than those with Medicare or private
insurance in the both the 2011—2013 and 2014—2017 time periods. There was no statistical change in
Medicaid acceptance rates between time periods.
TABLE 2. Percentage of Physicians Accepting Payments for New Patients by Coverage Type, 2011—2013
and 2014—2017
Years
Medicaid
Medicare
Private
2011—2013
73.0%
87.9%
*
95.6%
*
2014—2017
74.0
88.2
*
95.6
*
Notes: Estimates are among physicians accepting any new patients.
* indicates a statistically significant difference from Medicaid at the 0.05 level.
Source: MACPAC and State Health Access Data Assistance Center (SHADAC) analysis of 2011—2017 National Electronic Health
Records Survey (NEHRS) data.
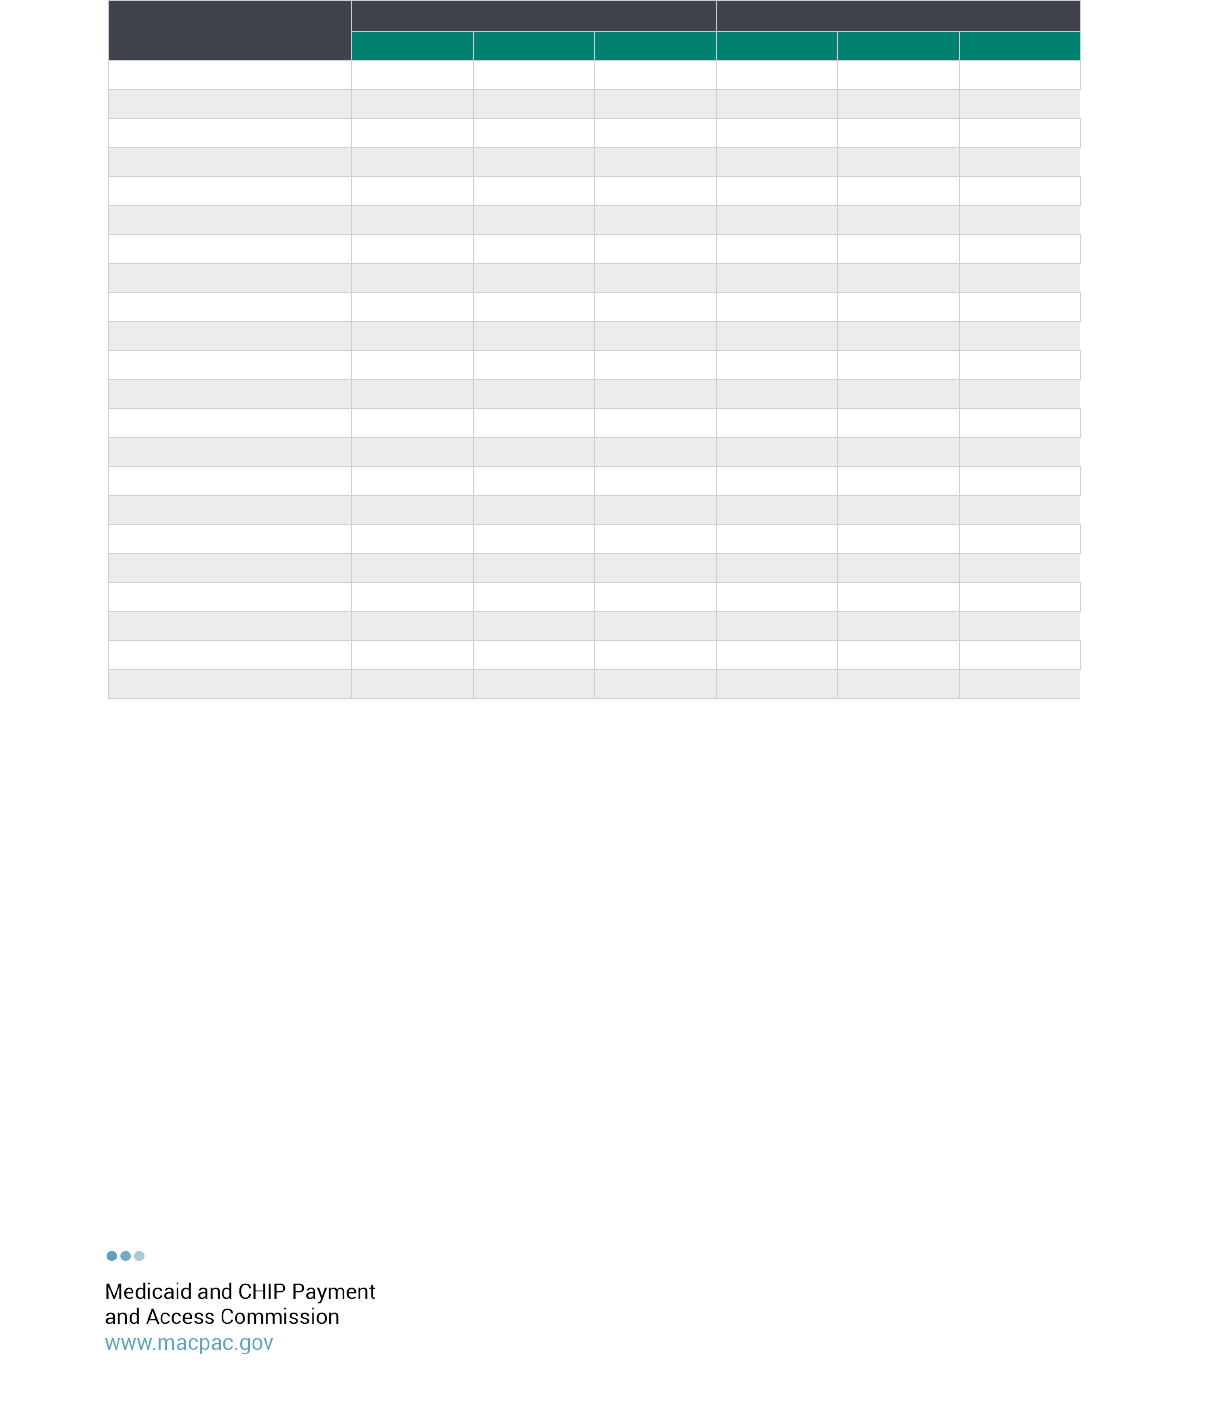
Acceptance by state
In the most recent time period (2014—2017), rates of physician acceptance of new Medicaid patients varied
by state, ranging from 42.2 percent in New Jersey to 99.4 percent in North Dakota (Appendix Table 1A). In
seven states (California, the District of Columbia, Florida, Louisiana, New Jersey, New York, and Texas),
acceptance rates were statistically lower than the national average, while rates were statistically higher than
the national average in 28 states. Acceptance of new Medicaid patients was not statistically different from
the national rate in all other states.
Physician acceptance of new Medicaid patients increased between the two time periods in six states (Idaho,
Massachusetts, Missouri, Ohio, Vermont, and West Virginia) and was statistically unchanged nationally and
in all other states.
Physician acceptance of new Medicaid patients was significantly lower compared to those for other payers
in most states in both time periods. The two exceptions were Alaska where acceptance rates were higher for
Medicaid than for Medicare in both time periods and in Wyoming during the 2011—2013 time period.
Acceptance by setting
Medicaid acceptance was much higher among physicians practicing in community health centers, mental
health centers, non-federal government clinics, and family planning clinics compared to the average for all
settings. Physicians affiliated with faculty practice plans and HMO practices also accepted Medicaid patients
at above-average rates. Acceptance of new Medicaid patients in these settings ranged from 80.7 percent in
—
—
•••
Medicaid and
CHIP
Payment
and Access Commission
www
.macpac.gov
4
non-federal government clinics in 2014—2017 to 100 percent acceptance in family planning clinics in
2011—2012 (Table 3).
Physicians in private solo or group practices accepted new Medicaid patients at rates below the average for
all settings. Among physicians accepting new patients, approximately seven out of 10 physicians in private
solo or group practices accepted new Medicaid patients. There were no significant changes in acceptance
within settings over time (i.e., comparing settings in 2011—2012 to settings in 2014—2017).
TABLE 3. Percentage of Physicians Who Accept New Medicaid Patients by Setting, 2011—2012 and
2014—2017
Setting
2011 2012
2014 2017
All Settings
73.0%
74.0%
Community health center
97.3
*
94.5
*
Faculty practice plan
92.4
*
90.2
*
Family planning clinic
100.0
*
―
Freestanding clinic or urgent care center
74.9
79.1
Health maintenance organization or
other prepaid practice
75.0
93.9
*
Mental health center
94.6
*
89.6
*
Non-federal government clinic
92.8
*
80.7
Private solo or group practice
69.9
*
70.4
*
Notes: Estimates are among physicians accepting any new patients.
* indicates a statistically significant difference from the acceptance rate in all settings in each time period, at the 0.05 level.
― indicates that the data were not eligible for disclosure.
Source: MACPAC and State Health Access Data Assistance Center (SHADAC) at the University of Minnesota analysis of 2011—
2017 National Electronic Health Records Survey (NEHRS) data.
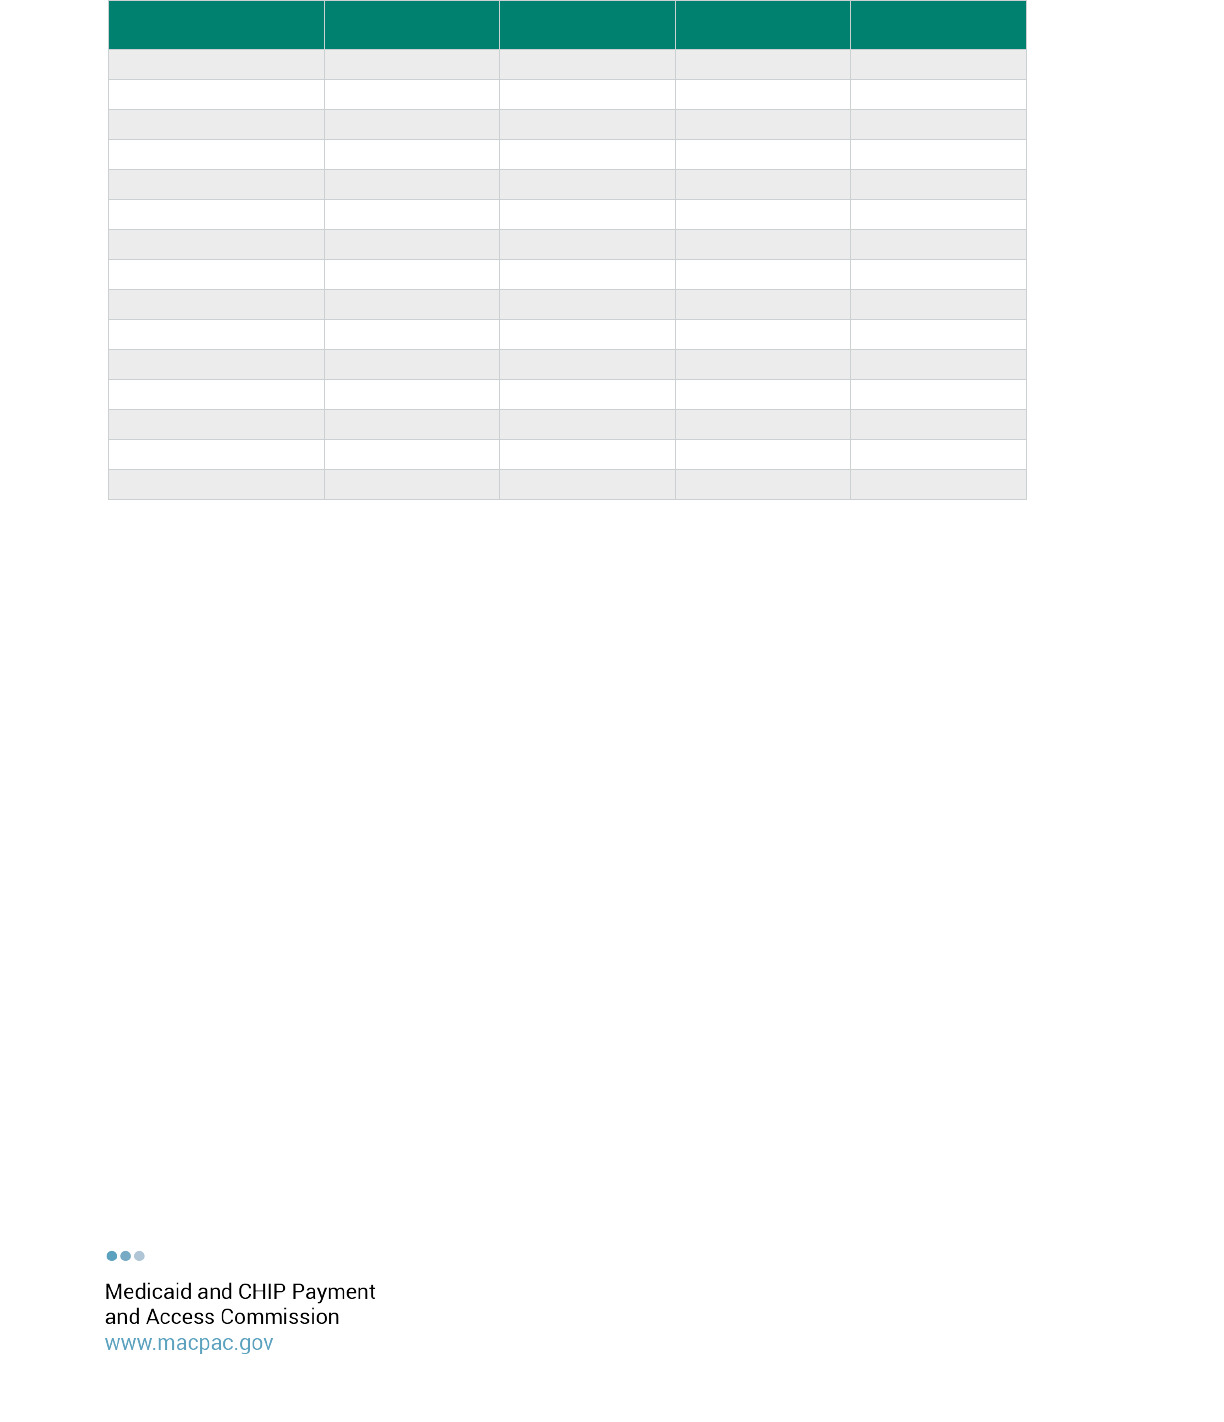
The association of practice setting with physician acceptance of Medicaid patients varied across states
(Appendix Table 2A).
4
Acceptance rates were lower than the average among physicians in private practices
and higher than average among those in clinics or HMO and faculty practices, for all 37 states where
differences in acceptance differed by setting. For example, in California, 89.5 percent of physicians in HMO
and faculty practices accepted new Medicaid patients, 85.6 percent of physicians in clinic settings accepted
new Medicaid patients, and 48.3 percent of physicians in private solo or group practices accepted new
Medicaid patients, compared to an average acceptance rate in all settings of 60.3 percent.
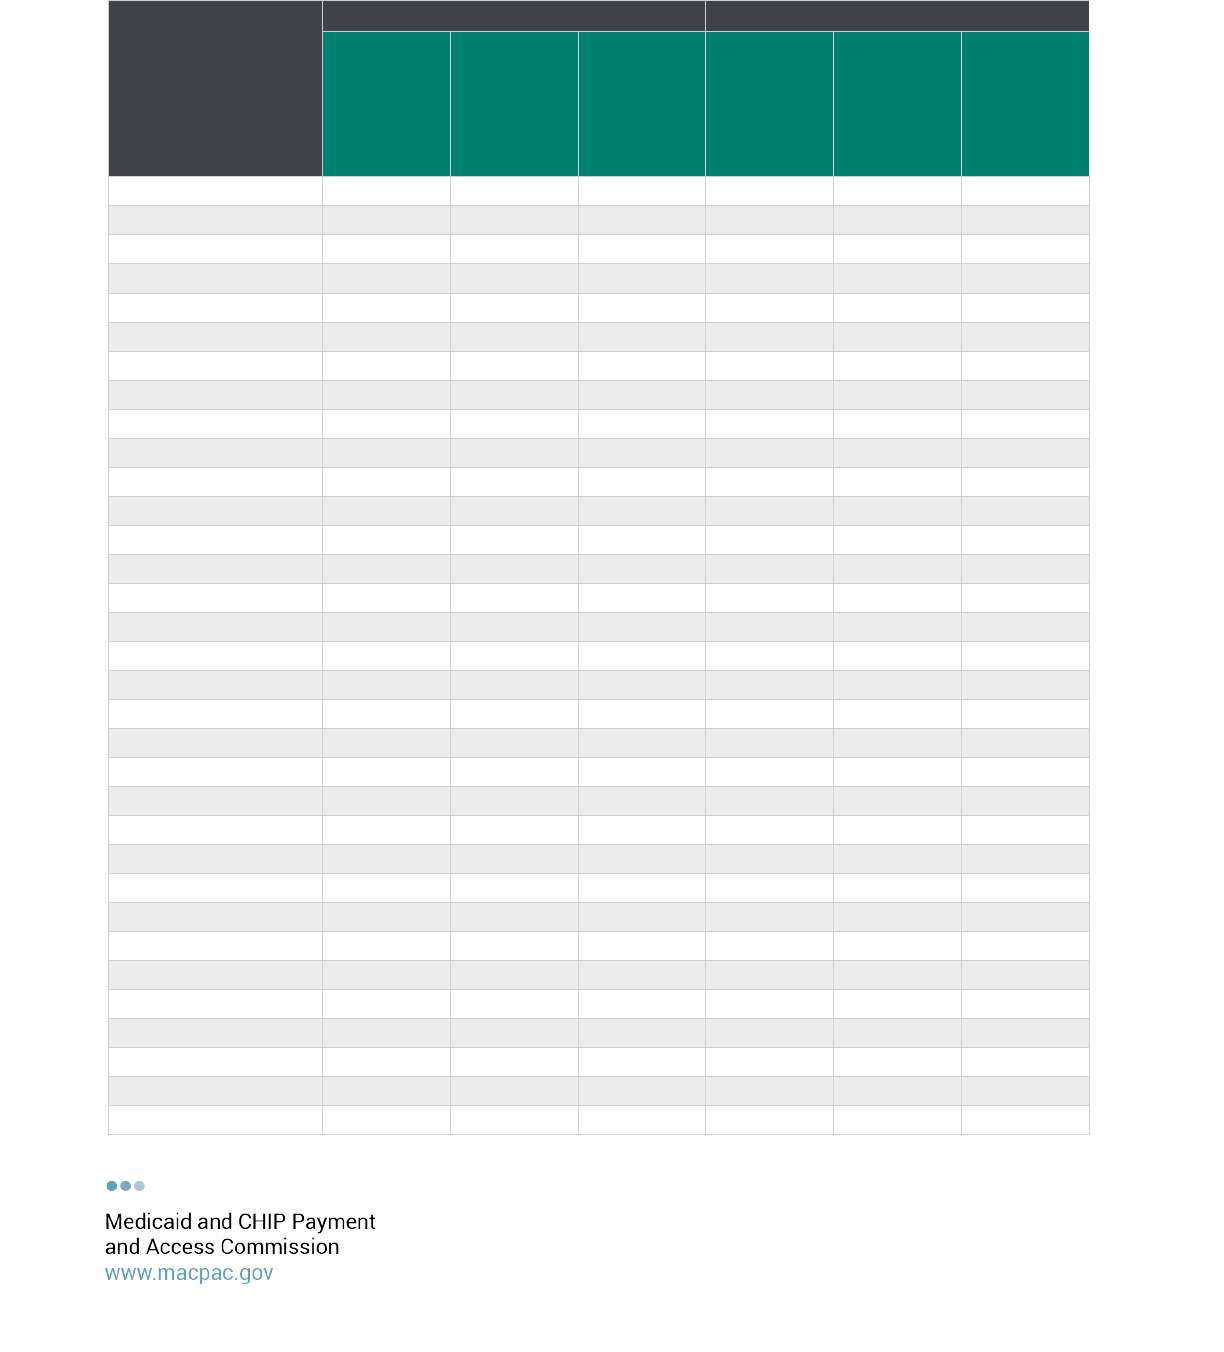
Acceptance by caseload
Physician acceptance of new Medicaid patients is only one measure of participation in the Medicaid
program. This measure alone does not indicate how many new patients a physician will accept, nor does it
account for the number of Medicaid patients already in a physician’s care. To go deeper, we also analyzed
whether physicians’ existing Medicaid caseloads were related to their willingness to accept new Medicaid
patients.
In general, physicians who had higher existing Medicaid caseloads accepted new Medicaid patients at
higher rates than average (Appendix Table 3A).
5
Those with below-average existing Medicaid caseloads
had lower Medicaid acceptance rates. This was the case in both time periods.

•••
Medicaid and
CHIP
Payment
and Access Commission
www
.macpac.gov
5
Specifically, of those accepting new Medicaid patients, physicians who had average or above-average
Medicaid caseloads accepted new Medicaid patients at a rate significantly higher than the average Medicaid
acceptance rate (87.4 percent compared to 63.8 percent in the most recent time period). Those who had
below-average caseloads accepted new Medicaid patients at a rate significantly lower than the average
Medicaid acceptance (52.0 percent in the most recent time period). There was little change between time
periods, and state-level results largely followed this same pattern.
6
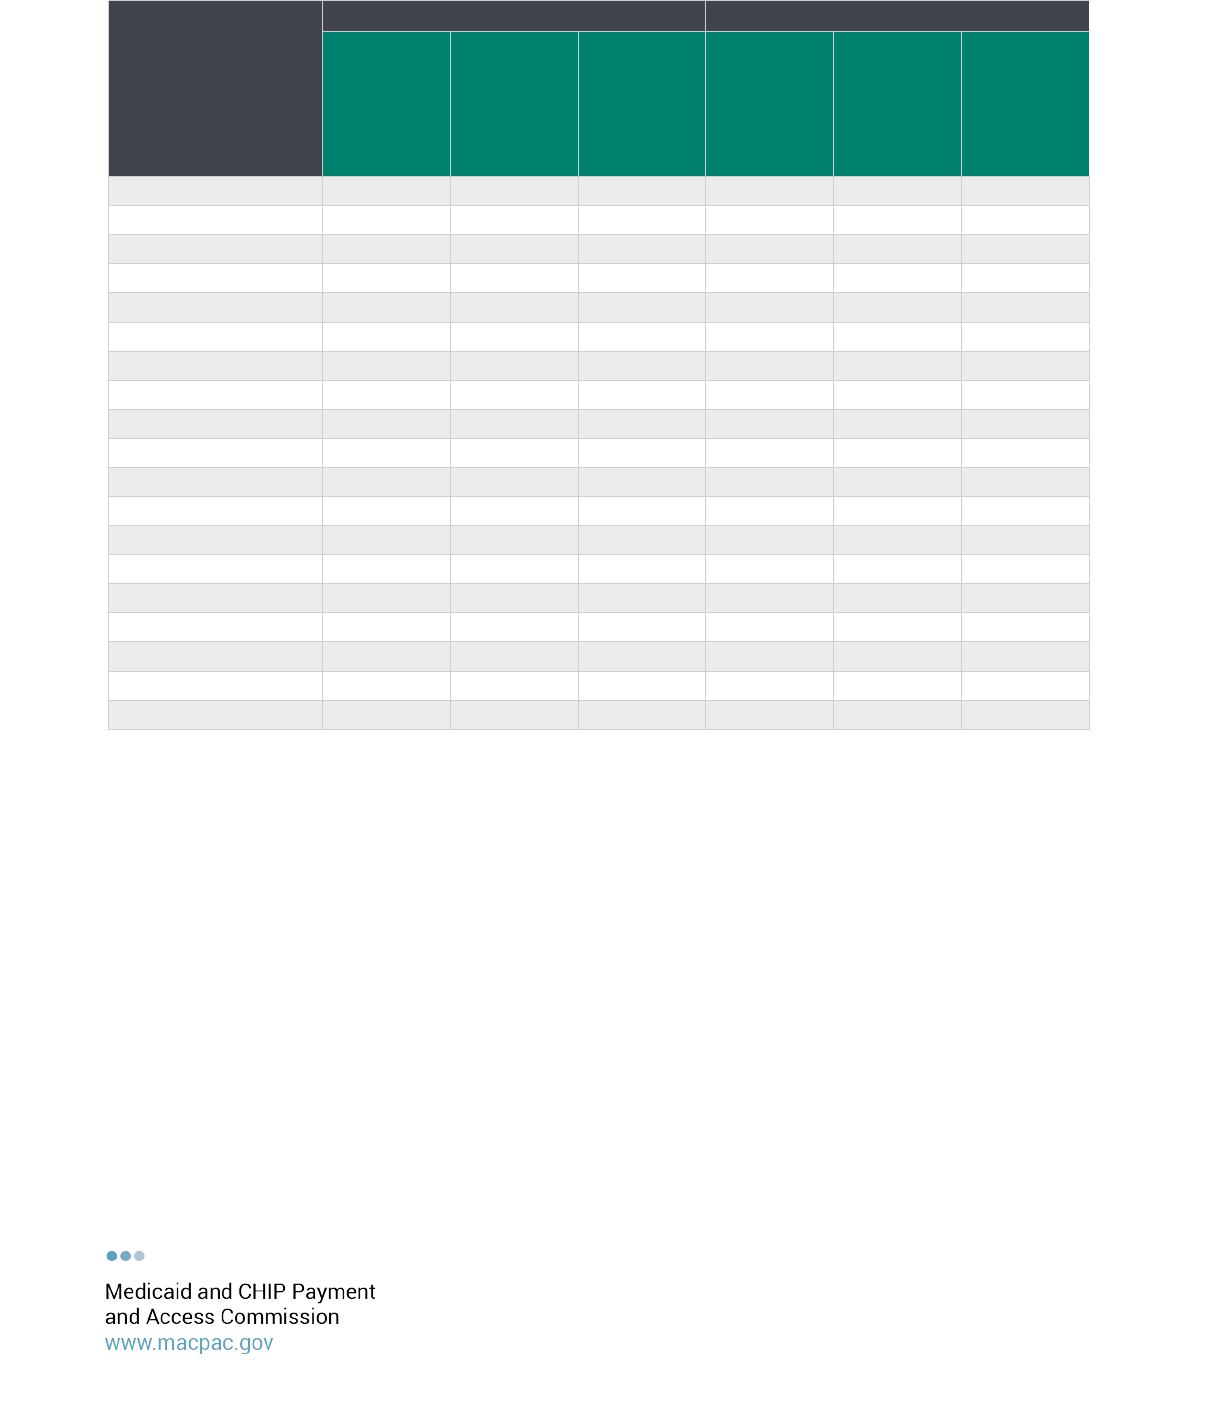
Mid-level providers
The presence of mid-level providers (such as nurse practitioners, physician assistants, and nurse midwives)
was associated with greater acceptance of new Medicaid patients (Appendix Table 4A). Overall, 73.7
percent of physicians accepting new patients accepted new Medicaid patients. Acceptance was higher (80.5
percent) among physicians in practices with an above-average ratio of mid-level providers and lower (68.9
percent) among physicians in practices with a below-average ratio of mid-level providers.
7
Results were similar at the state level for those states with significant differences. In seven states
(Minnesota, New Mexico, North Carolina, Oregon, Pennsylvania, Washington, and West Virginia), the share
of physicians accepting new Medicaid patients was higher when there was an above-average ratio of mid-
level providers in the practice. For example, in Pennsylvania, 77.3 percent of physicians accepted new
Medicaid patients. A smaller share (67.8 percent) of those with a below-average ratio of mid-level providers
accepted new Medicaid patients, while a larger share (91.2 percent) of those with above-average ratio of
mid-level providers accepted new Medicaid patients.
Endnotes
1
The NAMCS is a national survey designed to collect information about the provision and use of ambulatory medical care
services based on a sample of visits to office-based physicians. In addition to gathering information on electronic health record
adoption, the NEHRS also collects information about whether physicians are accepting new patients, as well as information on
the physician and practice characteristics. The NEHRS was originally designed as a supplement to the NAMCS before being
administered as an independent survey.
2
Data on the share of patients that are insured by Medicaid (physician caseloads) were not available for 2012. Detailed
settings data were not available for 2013.
3
Data are not shown in the table.
4
For this analysis, we collapsed the practice settings variable into three groups: private solo or group practice, clinics, and
HMO and faculty practices. Estimates within the other setting categories were still generally not meaningful to report. We
report estimates only for the 2014—2017 time period.
5
Because we wanted to examine the effect of Medicaid caseload on physician acceptance, we did not limit the caseload
analysis to those who were accepting new patients, but instead looked at all physicians. As such, the share of providers
accepting new Medicaid patients is smaller.
6
To further examine whether a provider’s existing caseload had an effect on acceptance of new Medicaid patients, we
grouped providers based on their relative Medicaid caseloads. The results were consistent with the analysis described above.
Among physicians with below average Medicaid caseloads, significantly fewer than average accepted new Medicaid patients,
while significantly more accepted new patients who are not insured by Medicaid, or were not accepting any new patients.
Among physicians with average or above average Medicaid caseloads, significantly more continued to accept new Medicaid

•••
Medicaid and
CHIP
Payment
and Access Commission
www
.macpac.gov
6
patients than average, and significantly fewer than average either did not accept new Medicaid patients or did not accept any
new patients. Overall, physicians who accepted new Medicaid patients had a significantly higher Medicaid caseload than
average, while physicians who did not accept new Medicaid patients, or did not accept any new patients, generally have
significantly smaller caseloads than average.
7
In addition to looking at the ratio of mid-level providers to the number of physicians, we also examined whether the number of
mid-level providers and the presence of any mid-level provider had any relationship with provider acceptance of new Medicaid
patients. The results were similar across all three approaches. This information is only available for 2014—2017, so we were
not able to compare across time periods.
References
Medicaid and CHIP Payment and Access Commission (MACPAC). 2019. Physician Acceptance of New Medicaid Patients:
New Findings. Washington, DC: MACPAC. https://www.macpac.gov/publication/physician-acceptance-of-new-medicaid-
patients-new-findings/.
—
—
FactSheet
I
I
I
I
I
I
I
I
I
I
I
I
I
I
I
••
•
Medicaid and
CHIP
Payment
and Access Commission
I
I
I
I
I
I
I
I
I
I
I
I
I
I
I
I
I
I
I
I
I
I
I
I
I
I
I
I
I
I
I
I
I
I
I
I
I
I
I
I
I
I
I
1800 M Street
NW
Suite 650 South
Washington,
DC
20036
(Q}
MACPAC
I
I
I
I
I
I
I
I
I
I
I
I
I
I
I
I
I
I
I
I
I
I
I
I
I
I
I
I
I
I
I
I
I
I
I
I
I
I
I
I
I
I
I
I
I
www.macpac.gov
202-350-2000 l
202-273-2452
1B
Appendix
TABLE 1A. Percentage of Physicians Who Accept New Patients by Coverage Type and State, 2011—2013
and 2014—2017
State
2011 2013
2014 2017
Medicaid
Medicare
Private
Medicaid
Medicare
Private
United States
73.0%
87.9%
*
95.6%
*
74.0%
88.2%
*
95.6%
*
Alabama
73.6
89.0
*
97.1
*
79.0
88.9
*
99.3
*
Alaska
90.1
†
77.7
*
97.0
*
92.4
†
82.3
*
96.2
Arizona
76.5
88.8
*
95.9
*
79.9
89.6
*
95.6
*
Arkansas
91.2
†
92.2
98.2
*
91.5
†
87.3
99.1
*
California
60.0
†
84.0
*
93.6
*
60.3
†
89.8
*
93.2
*
Colorado
70.6
82.4
*
93.8
*
79.5
87.7
97.4
*
Connecticut
72.2
86.0
*
97.9
*
74.2
85.1
*
96.5
*
Delaware
81.9
94.2
*
97.7
*
84.4
†
90.5
96.0
*
District of Columbia
68.5
84.2
*
79.2
59.9
†
81.3
*
80.3
*
Florida
58.6
†
90.2
*
95.0
*
55.0
†
84.8
*
93.9
*
Georgia
71.6
82.2
*
96.2
*
69.4
77.1
93.8
*
Hawaii
78.6
89.0
*
95.4
*
75.4
84.9
94.8
*
Idaho
86.1
†
89.4
98.1
*
92.7
†^
93.6
97.7
*
Illinois
68.0
87.6
*
94.9
*
73.6
88.3
*
96.3
*
Indiana
85.7
†
93.3
*
97.5
*
85.0
†
87.9
98.5
*
Iowa
95.7
†
94.5
98.1
94.2
†
96.1
98.4
*
Kansas
74.8
89.8
*
97.7
*
75.0
89.5
*
97.4
*
Kentucky
83.3
†
90.1
*
96.2
*
88.5
†
88.2
99.4
*
Louisiana
66.6
86.5
*
93.7
*
63.6
†
89.4
*
98.3
*
Maine
85.5
†
91.8
*
96.8
*
84.5
†
90.2
96.4
*
Maryland
70.6
82.8
*
89.2
*
75.2
87.6
*
94.0
*
Massachusetts
84.2
†
90.8
*
97.2
*
91.2
†^
91.7
96.9
Michigan
81.1
†
92.9
*
97.3
*
80.6
91.3
*
98.1
*
Minnesota
95.9
†
95.0
97.8
97.0
†
97.0
97.6
Mississippi
87.4
†
89.0
97.8
*
88.0
†
92.1
98.9
*
Missouri
68.8
89.2
*
96.7
*
78.1
^
88.4
*
97.4
*
Montana
92.2
†
93.0
97.5
*
93.5
†
93.6
98.8
*
Nebraska
93.0
†
91.9
97.6
*
95.3
†
94.3
100.0
*
Nevada
78.2
84.8
94.0
*
79.9
86.7
93.5
*
—
—
I
I
I
I
I
I
I
I
I
I
I
•••
Medicaid and
CHIP
Payment
and Access Commission
www
.macpac.gov
I
I
I
I
I
I
I
I
I
I
I
I I
I
I I I I I
I I I I I
I I I I I
I I I I I
I I I I I
I I I I I
I I I I I
I I I I I
I I I I I
I I I I I
8
State
2011 2013
2014 2017
Medicaid
Medicare
Private
Medicaid
Medicare
Private
New Hampshire
88.7
†
91.5
98.9
*
87.0
†
93.8
98.8
*
New Jersey
47.1
†
85.1
*
95.2
*
42.2
†
88.2
*
96.5
*
New Mexico
93.0
†
87.7
98.2
*
91.6
†
90.5
95.9
New York
62.3
†
88.2
*
96.4
*
62.6
†
86.5
*
90.6
*
North Carolina
83.9
†
85.5
97.1
*
85.7
†
84.6
97.5
*
North Dakota
97.8
†
97.5
99.1
99.4
†
98.3
98.8
Ohio
80.0
†
88.4
*
97.0
*
87.8
†^
85.0
97.0
*
Oklahoma
76.3
82.9
96.9
*
81.0
†
92.8
*
97.0
*
Oregon
81.5
†
84.1
95.5
*
82.6
†
83.4
95.4
*
Pennsylvania
79.8
†
93.4
*
96.2
*
77.5
92.6
*
97.2
*
Rhode Island
81.9
†
90.2
*
96.2
*
87.9
†
92.5
99.2
*
South Carolina
82.2
†
86.8
95.9
*
88.9
†
90.5
97.7
*
South Dakota
96.8
†
95.8
98.4
96.6
†
95.8
99.7
*
Tennessee
72.7
89.5
*
96.5
*
76.8
84.5
95.5
*
Texas
67.1
84.4
*
92.7
*
65.1
†
86.0
*
93.9
*
Utah
85.1
†
90.0
97.6
*
85.5
†
83.5
96.8
*
Vermont
91.6
†
92.8
98.0
*
97.2
†^
96.5
99.5
Virginia
74.7
84.7
*
95.7
*
76.3
86.8
*
95.2
*
Washington
78.9
†
87.0
*
95.2
*
80.2
89.0
*
97.4
*
West Virginia
89.9
†
90.6
97.1
*
96.4
†^
94.8
98.5
Wisconsin
95.2
†
96.4
98.9
*
98.1
†
98.1
99.0
Wyoming
97.1
†
92.5
*
97.2
95.5
†
91.3
97.9
Notes: Estimates are among physicians accepting any new patients.
* indicates a statistically significant difference from Medicaid at the 0.05 level
†
indicates a statistically significant difference from the average US acceptance rate at the 0.05 level.
^ indicates a statistically significant difference in Medicaid acceptance rates between time periods at the 0.05 level.
Source: MACPAC and State Health Access Data Assistance Center (SHADAC) at the University of Minnesota analysis of 2011—2017
National Electronic Health Records Survey (NEHRS) data.

•••
Medicaid and
CHIP
Payment
and Access Commission
www
.macpac.gov
9
TABLE 2A. Percentage of Physicians Who Accept New Medicaid Patients by Setting, 2014—2017
State All settings Private Clinic
HMO or faculty
plan
United States
74.0%
70.4%
†
85.3%
†
91.2%
†
Alabama
79.0
78.5
*
60.9
100.0
*
†
Alaska
92.4
90.7
*
97.5
*
–
Arizona
79.9
79.4
*
80.4
88.1
Arkansas
91.5
91.8
*
88.1
–
California
60.3
48.3
*
85.6
†
89.5
†
Colorado
79.5
75.6
95.0
*
†
89.7
Connecticut
74.2
72.8
71.9
92.3
†
Delaware
84.4
82.7
*
93.1
100.0
*
†
District of Columbia
59.9
48.5
*
89.0
†
79.4
Florida
55.0
52.7
*
57.0
87.0
†
Georgia
69.4
65.9
82.3
100.0
*
†
Hawaii
75.4
70.1
78.3
94.4
†
Idaho
92.7
91.5
*
100.0
*
†
92.6
Illinois
73.6
71.0
83.1
83.8
Indiana
85.0
83.5
*
89.3
100.0
*
†
Iowa
94.2
93.4
*
96.8
*
100.0
*
†
Kansas
75.0
73.1
78.5
85.8
Kentucky
88.5
86.0
*
92.7
100.0
*
†
Louisiana
63.6
59.6
*
87.2
†
100.0
*
†
Maine
84.5
81.1
*
90.8
100.0
*
†
Maryland
75.2
70.5
90.3
95.8
†
Massachusetts
91.2
90.5
*
92.0
93.1
Michigan
80.6
78.1
*
91.6
100.0
*
†
Minnesota
97.0
96.6
*
96.3
*
100.0
*
†
Mississippi
88.0
86.2
*
94.9
*
100.0
*
†
Missouri
78.1
73.9
88.9
93.7
†
Montana
93.5
92.0
*
100.0
*
†
100.0
*
†
Nebraska
95.3
94.3
*
100.0
*
†
100.0
*
†
Nevada
79.9
77.9
89.6
–
New Hampshire
87.0
84.0
*
94.9
100.0
*
†
New Jersey
42.2
40.0
*
72.0
64.4
New Mexico
91.6
90.4
*
92.0
100.0
*
†
New York
62.6
61.9
58.4
70.0
North Carolina
85.7
83.0
*
100.0
*
†
100.0
*
†
North Dakota
–
100.0
*
97.7
*
100.0
*
Ohio
87.8
86.9
*
86.6
100.0
*
†
•••
Medicaid and
CHIP
Payment
and Access Commission
www
.macpac.gov
10
State All settings Private Clinic
HMO or faculty
plan
Oklahoma
81.0
80.1
*
73.6
100.0
*
†
Oregon
82.6
80.2
*
90.7
94.4
Pennsylvania
77.5
72.7
85.9
99.8
*
†
Rhode Island
87.9
85.9
*
89.8
100.0
*
†
South Carolina
88.9
89.4
*
80.9
100.0
*
†
South Dakota
96.6
95.8
*
100.0
*
†
–
Tennessee
76.8
73.6
94.2
†
100.0
*
†
Texas
65.1
60.9
*
81.4
80.5
Utah
85.5
84.5
*
78.1
100.0
*
†
Vermont
97.2
94.9
*
100.0
*
†
100.0
*
†
Virginia
76.3
72.8
89.6
100.0
*
†
Washington
80.2
74.5
94.6
*
†
92.9
West Virginia
96.4
95.7
*
96.4
*
100.0
*
†
Wisconsin
98.1
97.2
*
100.0
*
100.0
*
Wyoming
95.5
96.0
*
93.8
*
–
Notes: Estimates are among physicians accepting any new patients. HMO is health management organization.
† indicates a statistically significant difference from the average rate of accepting new Medicaid patients among physicians in all settings within
that state, at the 0.05 level.
* indicates a statistically significant difference from the average U.S. acceptance rate in that setting at the 0.05 level.
– indicates that the data were not eligible for disclosure.
Source: MACPAC and State Health Access Data Assistance Center (SHADAC) at the University of Minnesota analysis of 2014—2017
National Electronic Health Records Survey (NEHRS) data.
—
•••
Medicaid and
CHIP
Payment
and Access Commission
www
.macpac.gov
11
TABLE 3A. Percentage of All Physicians Who Accept New Medicaid Patients by Share of Their Patients
Covered by Medicaid, by State, 2011 and 2013 and 2014—2017
State
2011 and 2013
2014 2017
All
Share of
Medicaid
patients
above the
national
average
Share of
Medicaid
patients
below the
national
average
All
Share of
Medicaid
patients
above the
national
average
Share of
Medicaid
patients
below the
national
average
United States
62.5%
90.5%
†
46.7%
†
63.8%
87.4%
†^
52.0%
†^
Alabama
62.2
–
52.7
†
69.6
95.5
†
59.8
†
Alaska
86.4
92.3
81.4
88.0
96.1
†
79.9
†
Arizona
69.7
87.2
†
44.7
†
72.7
96.9
†^
57.1
†
Arkansas
88.5
–
79.0
†
88.0
96.3
†
81.4
California
46.3
–
26.4
†
50.0
73.2
†
36.5
†
Colorado
60.6
–
48.5
†
72.0
92.0
†
61.7
†
Connecticut
67.1
–
53.7
†
64.1
84.8
†
55.1
†
Delaware
75.8
88.5
†
65.6
†
74.6
87.7
†
63.1
†
District of Columbia
54.9
–
26.6
†
52.4
–
35.3
†
Florida
51.7
–
37.6
†
44.5
87.1
†
24.9
†^
Georgia
65.3
92.0
†
46.2
†
62.5
95.6
†
51.5
†
Hawaii
63.7
82.5
†
51.0
†
62.6
86.2
†
49.9
†
Idaho
79.9
95.1
†
64.1
†
86.6
96.0
†
78.4
†
Illinois
63.6
89.5
†
48.1
†
67.2
97.2
†
48.9
†
Indiana
73.0
89.2
†
61.9
†
77.2
88.0
†
72.1
Iowa
83.4
92.7
†
77.3
87.0
89.5
85.8
Kansas
62.8
–
51.3
†
67.2
90.8
†
57.2
†
Kentucky
75.6
90.1
†
61.2
†
76.1
94.7
†
60.0
†
Louisiana
55.1
94.2
†
29.8
†
53.8
87.3
†
36.6
†
Maine
70.3
85.0
†
54.3
†
68.9
83.9
†
55.6
†
Maryland
58.7
87.7
†
45.7
†
57.2
85.0
†
44.4
†
Massachusetts
72.2
86.4
†
62.8
†
76.6
91.0
†
69.5
Michigan
65.7
88.1
†
53.7
†
73.0
88.3
†
65.0
†
Minnesota
88.8
–
89.4
91.9
–
89.6
Mississippi
76.8
92.8
†
64.2
†
78.3
94.9
†
65.8
†
Missouri
61.4
89.0
†
46.2
†
68.6
90.5
†
57.1
†
Montana
84.5
91.7
80.2
83.0
90.3
79.4
Nebraska
90.5
97.2
†
85.6
89.8
96.4
†
86.5
Nevada
72.1
–
63.4
†
72.1
–
59.6
†
New Hampshire
79.0
–
72.9
78.8
95.6
†
69.4
†
New Jersey
37.6
–
20.9
†
32.8
–
23.5
†
New Mexico
85.2
94.0
†
68.4
†
80.2
96.2
†
57.3
†
—
•••
Medicaid and
CHIP
Payment
and Access Commission
www
.macpac.gov
12
State
2011 and 2013
2014 2017
All
Share of
Medicaid
patients
above the
national
average
Share of
Medicaid
patients
below the
national
average
All
Share of
Medicaid
patients
above the
national
average
Share of
Medicaid
patients
below the
national
average
New York
51.1
87.0
†
30.9
†
52.0
–
41.6
†
North Carolina
75.1
93.4
†
59.6
†
77.7
93.1
†
68.1
†
North Dakota
93.3
94.5
92.4
88.7
–
89.7
Ohio
69.8
88.9
†
58.8
†
79.7
91.1
†
72.0
Oklahoma
71.5
94.7
†
52.2
†
70.4
84.3
†^
62.2
†
Oregon
74.8
88.6
†
62.4
†
70.2
86.4
†
59.5
†
Pennsylvania
67.9
93.6
†
55.6
†
66.5
–
60.2
Rhode Island
70.3
–
63.9
†
72.2
84.9
†
64.5
South Carolina
73.9
92.6
†
58.8
†
80.6
93.9
†
70.3
†
South Dakota
93.8
97.4
90.9
90.0
88.9
90.5
Tennessee
62.2
87.0
†
46.5
†
68.5
89.3
†
58.9
†
Texas
58.4
94.7
†
38.9
†
56.0
89.9
†
40.9
†
Utah
74.8
–
67.7
†
70.2
–
65.5
Vermont
78.8
85.7
†
67.4
†
84.3
90.9
†
69.3
†
Virginia
68.2
94.3
†
54.0
†
68.0
91.6
†
60.8
†
Washington
65.7
86.2
†
50.2
†
67.9
90.1
†
54.3
†
West Virginia
75.6
81.9
69.0
88.7
93.6
†^
80.8
Wisconsin
85.1
90.8
80.1
83.4
83.4
83.4
Wyoming
93.3
94.9
91.7
89.0
93.9
85.4
Notes: Estimates are among all physicians, not just those accepting new patients.
† indicates a statistically significant difference from the rate of accepting new Medicaid patients among all physicians in the state during the
time period, at the 0.05 level.
^ indicates a statistically significant difference in acceptance rates between time periods, at the 0.05 level.
– indicates that the data were not eligible for disclosure.
Source: MACPAC and State Health Access Data Assistance Center (SHADAC) at the University of Minnesota analysis of 2011—2017
National Electronic Health Records Survey (NEHRS) data.
-
-
1
•••
Medicaid and
CHIP
Payment
and Access Commission
www
.macpac.gov
1 1
13
TABLE 4A. Percentage of Physicians Who Accept New Patients by Payment Type and by Ratio of Mid-Level
Providers, by State, 2014—2017
State
All Physicians
Accepting New
Medicaid Patients
Below average ratio of
mid level providers
Above average ratio of
mid level providers
United States
73.7
68.9
*
80.5
*
Alabama
78.9
74.7
85.1
Alaska
92.4
91.0
93.5
Arizona
79.9
79.0
81.0
Arkansas
91.4
87.4
95.6
California
58.4
53.7
–
Colorado
79.4
74.8
84.2
Connecticut
74.1
74.1
74.2
Delaware
84.4
80.8
89.0
District of Columbia
59.0
60.4
–
Florida
54.4
51.2
60.4
Georgia
69.4
64.1
76.3
Hawaii
75.1
68.7
–
Idaho
92.7
89.3
94.9
Illinois
73.9
71.0
78.6
Indiana
84.5
82.6
86.9
Iowa
94.2
91.2
96.2
Kansas
75.3
74.9
75.8
Kentucky
88.5
86.0
91.2
Louisiana
63.4
57.9
71.6
Maine
84.3
83.5
85.5
Maryland
74.8
74.5
75.1
Massachusetts
90.9
86.3
95.5
Michigan
81.3
79.4
84.5
Minnesota
96.8
–
99.0
*
Mississippi
87.9
89.2
85.7
Missouri
77.5
73.2
84.8
Montana
93.4
93.2
93.6
Nebraska
95.2
96.1
94.6
Nevada
79.8
81.6
–
New Hampshire
87.4
82.6
90.5
New Jersey
41.9
39.1
–
New Mexico
91.5
86.0
96.2
*
New York
62.2
59.4
66.6
-
-
•••
Medicaid and
CHIP
Payment
and Access Commission
www
.macpac.gov
14
State
All Physicians
Accepting New
Medicaid Patients
Below average ratio of
mid level providers
Above average ratio of
mid level providers
North Carolina
85.6
79.9
92.5
*
North Dakota
99.4
–
99.0
Ohio
87.5
86.8
–
Oklahoma
80.9
78.5
84.4
Oregon
82.7
75.7
90.3
*
Pennsylvania
77.3
67.8
*
91.2
*
Rhode Island
87.8
86.2
–
South Carolina
88.8
87.0
91.7
South Dakota
96.5
98.2
95.9
Tennessee
77.6
74.0
81.7
Texas
64.6
61.8
68.5
Utah
85.1
85.8
84.2
Vermont
97.1
98.1
96.2
Virginia
76.3
75.0
78.1
Washington
80.2
74.1
88.8
*
West Virginia
96.3
93.8
98.9
*
Wisconsin
98.9
97.3
–
Wyoming
95.5
94.9
96.1
Notes: Estimates are among physicians accepting any new patients.
* indicates a statistically significant difference from the state’s Medicaid acceptance rate for physicians in all practices accepting new patients
at the 0.05 level.
-- indicates estimate is unreliable because it has a relative standard error greater than or equal to 30 percent.
Source: MACPAC and State Health Access Data Assistance Center (SHADAC) at the University of Minnesota analysis of 2014—2017
National Electronic Health Records Survey (NEHRS) data.
